Coldest Winter in 100 Years

IT DOES NOT PROVE MANKIND IS THE CAUSE EVEN IF IT IS TRUE!!!

Don't waste your time... these folks believe what they want to blieve.. remember, these are the tards that voted for "Hope and Change" only to put a man in office who is owned by the banking industry and labor unions.
I know, they voted for hoax and spare change. They're now pushing the big lie theory in hopes it changes reality. That's why we must refute it vocally because you never know who may be watching, and if there is no "shut the fuck up, stupid", response, they may assume it's true.

It's not for their benefit, but to prevent others from falling victim to them.
 
Simple, it's a lie created by Jones, Hansen and Mann.

The Medieval Warm Period was much warmer than we are today, yet this is ignored by Mann, Jones and Hansen because it fucks their desired result to hell and gone. If you want to stick to instruments the 1930's were as warm as well as having the hottest year on record once you ignore the triad of liars you worship so.
As I said, when CON$ are caught lying, they just keep on lying, while accusing everyone else of lying.

The 1930s are not even close to the hottest years of direct instrument measurement.

global-jan-dec-error-bar-pg.gif
Son, you don't know whether you're shot, fucked, powder-burned or snake bit.

You keep pimping that graph as if it's an proof of something. Imma tell you AGAIN...

IT DOES NOT PROVE MANKIND IS THE CAUSE EVEN IF IT IS TRUE!!!

mmkay???
Child, it does prove you lied about the 1930s.

mmkay???
 
Uhhhh no. Many credible (aka not suckers for AGW) climatologist believe this. Look in your enemies roladex and you will find a few.
 
As I said, when CON$ are caught lying, they just keep on lying, while accusing everyone else of lying.

The 1930s are not even close to the hottest years of direct instrument measurement.

global-jan-dec-error-bar-pg.gif

So what was the Technology they were Using in 1880 over the Ocean?... Over the Land?... In 1920?...

Can you Compare it to Today for us?


:)

peace...

____

Yes indeed! So easy to manipulate those #s because they are so often "estimates".
As I said, when caught lying CON$ just keep on lying.

The only "estimates" are the margins of error, the gray lines on the chart. If you are observant, you will see the gray lines are longer on the older data.

You don't want to Deal with my Question, do you... :rofl:

:)

peace...
 
But far more reliable and relevant is the satellite data on atmospheric temperatures, which is not distorted by the location, coverage, and surrounding activities of land-based weather stations (highly unreliable outside the U.S. and Europe). The satellite data starts in 1979 and shows no increase in global temperature trends until 1998, when the El Niño that year caused a sharp temperature spike. The most recent temperature declines have now apparently completely offset that 1998 increase, leaving the satellite record with no net increase in global temperature for the past 30 years—or maybe even a slight decline.

Global temperatures were also warmer than today during the Medieval Warm Period, a period of several hundred years around 1000 AD. Even higher temperatures prevailed during a period known as the Holocene Climate Optimum, which ran roughly from 8,000 years ago (6000 BC) to 4,000 years ago (2000 BC). In fact, temperatures were higher than today during most of the period from 9000 BC to the birth of Christ. Yet there was no significant human burning of fossil fuels during these periods.


...ALL SCIENTISTS AGRE that if man-made global warming is real, it would leave a fingerprint in the form of temperatures increasing with altitude in the tropical troposphere portion of the atmosphere up to a hotspot about 10 kilometers above the surface, reflecting the pattern of CO2 and other greenhouse gases in the atmosphere. Warming due to solar variations or other natural causes would not leave such a fingerprint pattern. Recently, higherquality temperature data from balloons and satellites now enables us to settle the man-made global warming debate definitively.

The data from weather balloons shows the opposite pattern: no increasing warming with altitude, but rather a slight cooling, with no hotspot. The satellite data shows the same result: no increasing temperature with altitude, no hotspot, no fingerprint, maybe again a slight cooling with altitude. Game over. QED. The global warming empire is rattling around but has not and cannot come up with an effective response. The data is the data. The science is the science. Man-made global warming is a hoax developed to serve powerful special interests.


Full article here:


The American Spectator : Why the World Is Getting Warmer, Even Though It Is Getting Colder
 
____

Yes indeed! So easy to manipulate those #s because they are so often "estimates".
As I said, when caught lying CON$ just keep on lying.

The only "estimates" are the margins of error, the gray lines on the chart. If you are observant, you will see the gray lines are longer on the older data.

You don't want to Deal with my Question, do you... :rofl:

:)

peace...
Your question is a moronic dodge to avoid explaining how the last decade could be warmer than the previous decade if warming stopped 11 years ago, but I'll humor you.

They used thermometers in 1880, the difference with today is there are more measuring stations today than in 1880, hence the greater margin of error for the 1880s.

Now back in the medieval warm period they use PROXY data from even fewer locations, so that data is highly suspect, but you deniers put absolute faith in it over direct instrument measurement.
 
But far more reliable and relevant is the satellite data on atmospheric temperatures, which is not distorted by the location, coverage, and surrounding activities of land-based weather stations (highly unreliable outside the U.S. and Europe). The satellite data starts in 1979 and shows no increase in global temperature trends until 1998, when the El Niño that year caused a sharp temperature spike. The most recent temperature declines have now apparently completely offset that 1998 increase, leaving the satellite record with no net increase in global temperature for the past 30 years—or maybe even a slight decline.

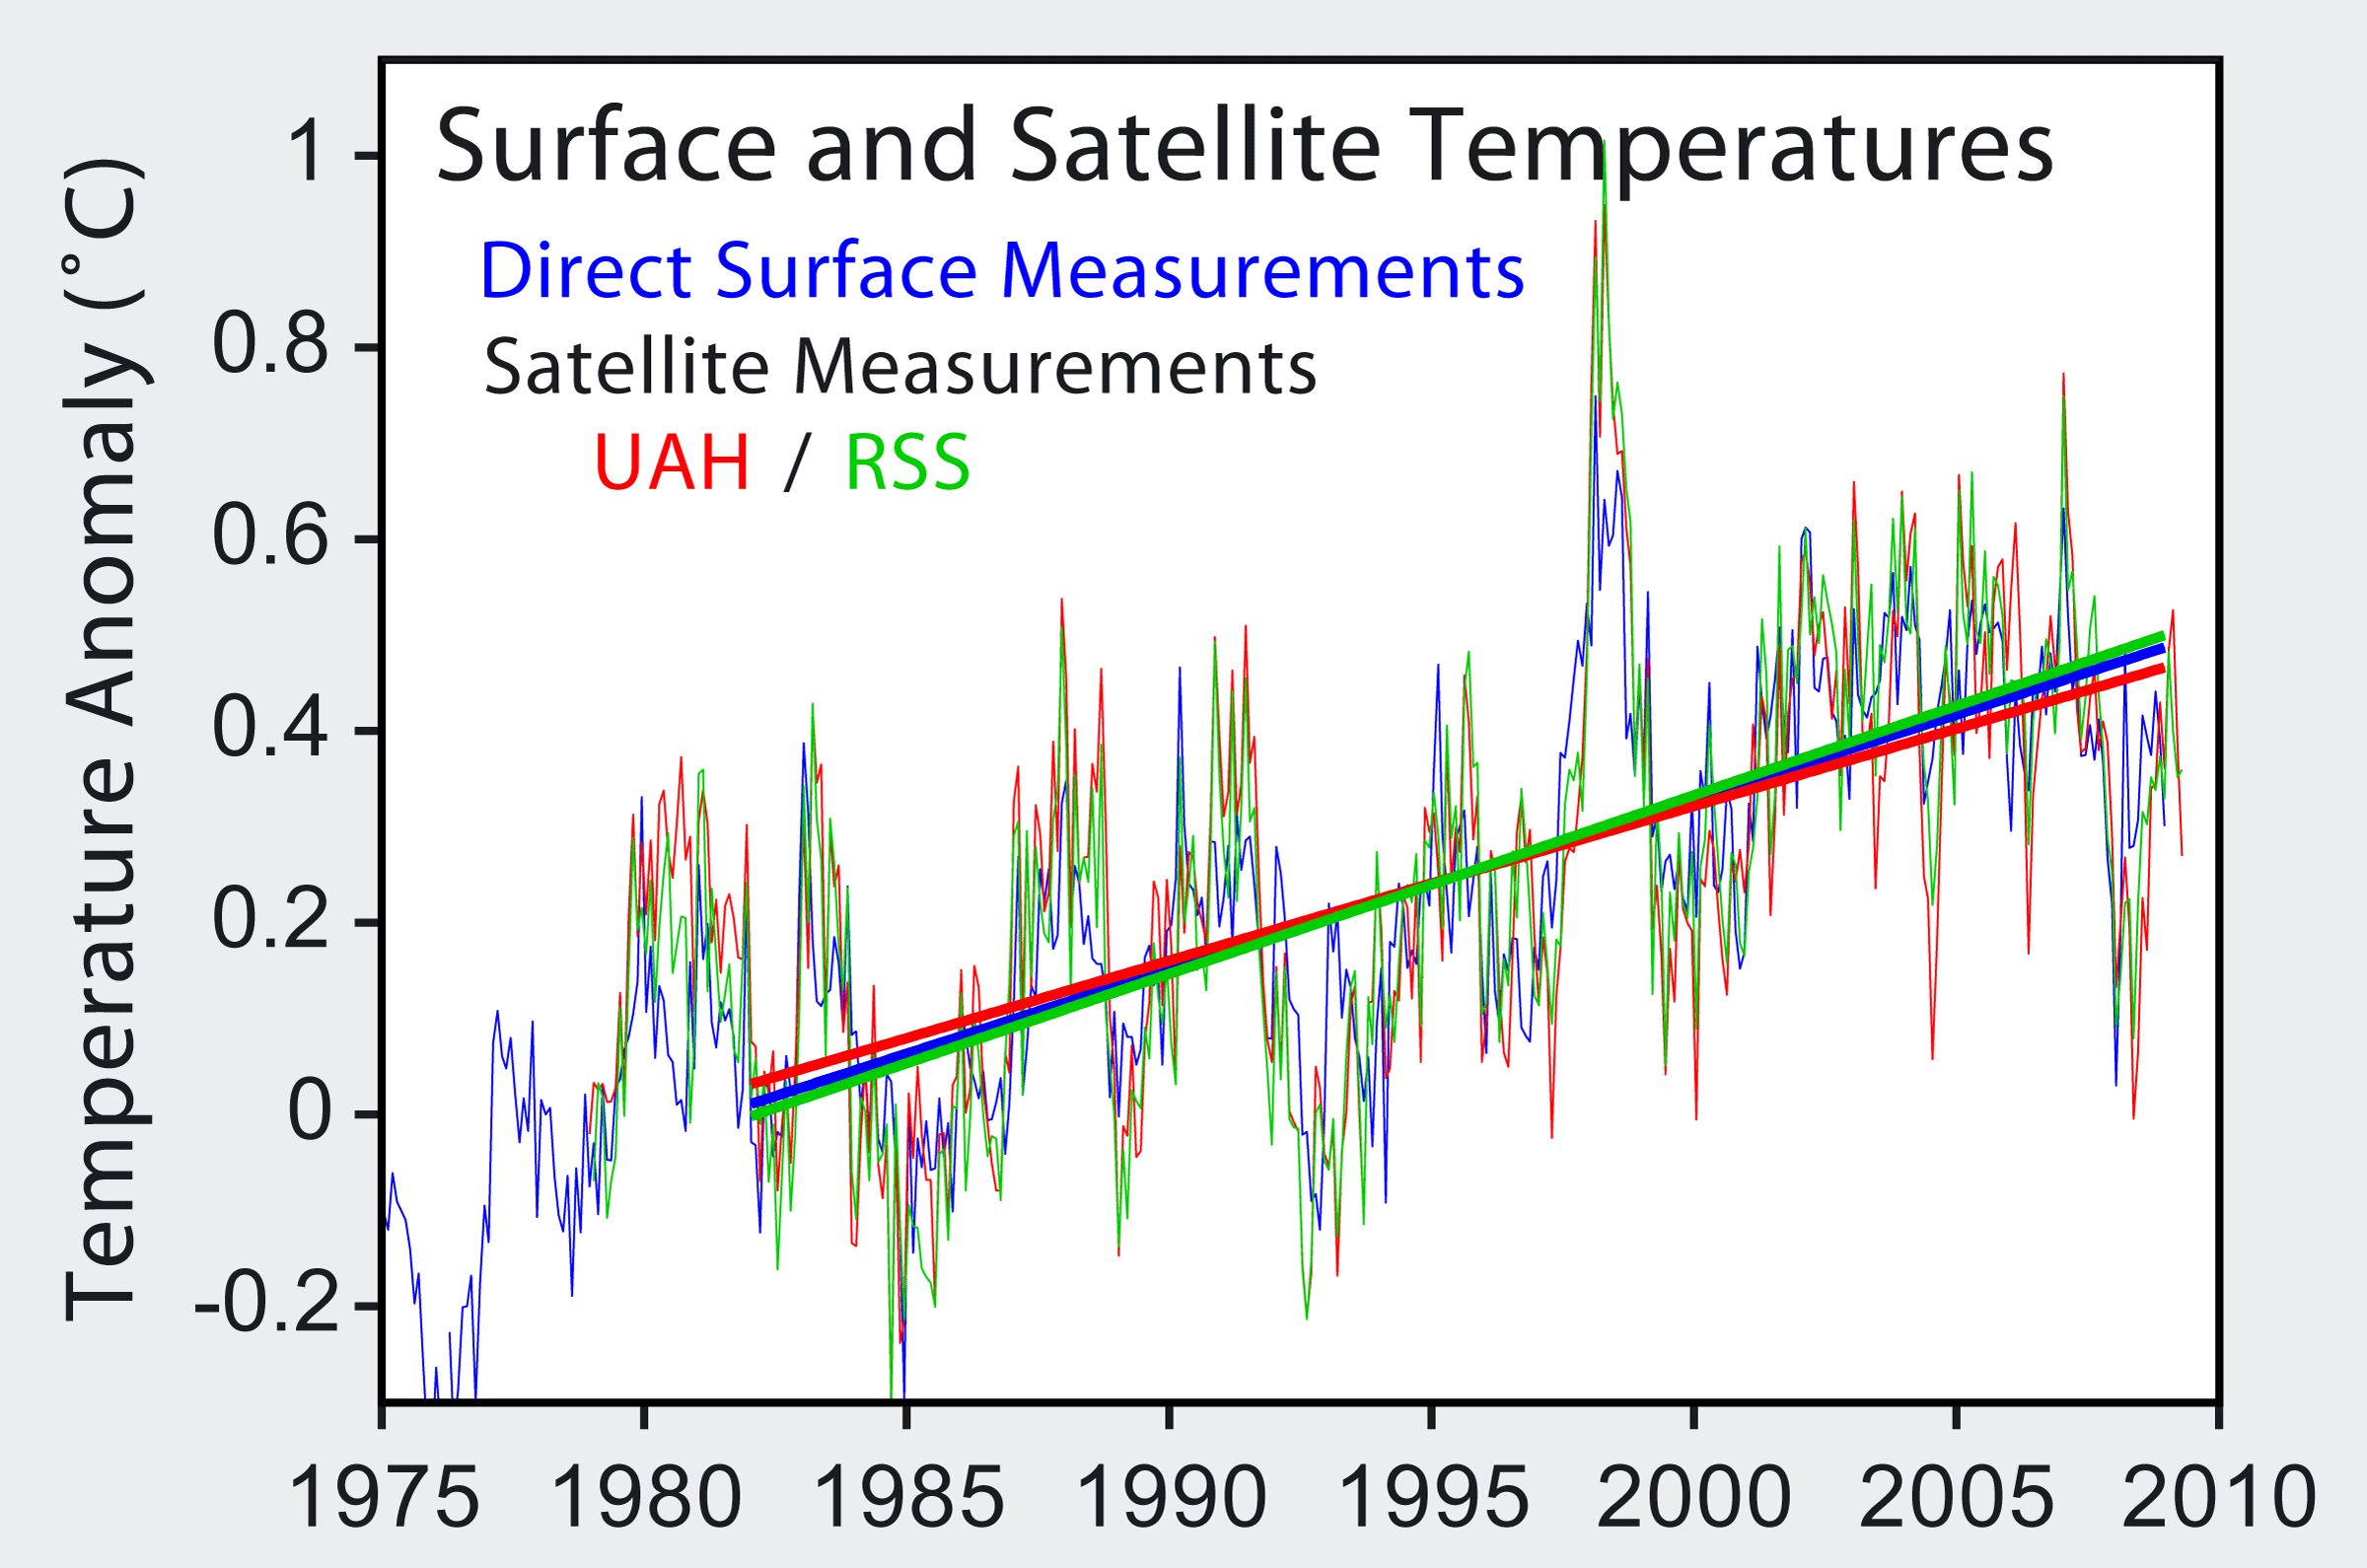
As I said, whenever CON$ are caught lying they just keep on lying. As I have already posted, only the cooked UAH satellite data showed no warming. Christy and Spencer accomplished this by using the opposite sign for correcting diurnal satellite drift. After the correct sign was used even the UAH data shows warming and matches the ground measurements, and Christy even admitted it in the below report he co-authored.

http://www.climatescience.gov/Library/sap/sap1-1/finalreport/sap1-1-final-execsum.pdf

Previously reported discrepancies between the amount of warming
near the surface and higher in the atmosphere have been used to
challenge the reliability of climate models and the reality of humaninduced
global warming. Specifically, surface data showed substantial
global-average warming, while early versions of satellite and radiosonde
data showed little or no warming above the surface. This significant
discrepancy no longer exists because errors in the satellite and
radiosonde data have been identified and corrected.
New data sets
have also been developed that do not show such discrepancies.

Satellite_Temperatures.png
 
Last edited:
+

But far more reliable and relevant is the satellite data on atmospheric temperatures, which is not distorted by the location, coverage, and surrounding activities of land-based weather stations (highly unreliable outside the U.S. and Europe). The satellite data starts in 1979 and shows no increase in global temperature trends until 1998, when the El Niño that year caused a sharp temperature spike. The most recent temperature declines have now apparently completely offset that 1998 increase, leaving the satellite record with no net increase in global temperature for the past 30 years—or maybe even a slight decline.

Global temperatures were also warmer than today during the Medieval Warm Period, a period of several hundred years around 1000 AD. Even higher temperatures prevailed during a period known as the Holocene Climate Optimum, which ran roughly from 8,000 years ago (6000 BC) to 4,000 years ago (2000 BC). In fact, temperatures were higher than today during most of the period from 9000 BC to the birth of Christ. Yet there was no significant human burning of fossil fuels during these periods.


...ALL SCIENTISTS AGRE that if man-made global warming is real, it would leave a fingerprint in the form of temperatures increasing with altitude in the tropical troposphere portion of the atmosphere up to a hotspot about 10 kilometers above the surface, reflecting the pattern of CO2 and other greenhouse gases in the atmosphere. Warming due to solar variations or other natural causes would not leave such a fingerprint pattern. Recently, higherquality temperature data from balloons and satellites now enables us to settle the man-made global warming debate definitively.

The data from weather balloons shows the opposite pattern: no increasing warming with altitude, but rather a slight cooling, with no hotspot. The satellite data shows the same result: no increasing temperature with altitude, no hotspot, no fingerprint, maybe again a slight cooling with altitude. Game over. QED. The global warming empire is rattling around but has not and cannot come up with an effective response. The data is the data. The science is the science. Man-made global warming is a hoax developed to serve powerful special interests.


Full article here:


The American Spectator : Why the World Is Getting Warmer, Even Though It Is Getting Colder
 
But far more reliable and relevant is the satellite data on atmospheric temperatures, which is not distorted by the location, coverage, and surrounding activities of land-based weather stations (highly unreliable outside the U.S. and Europe). The satellite data starts in 1979 and shows no increase in global temperature trends until 1998, when the El Niño that year caused a sharp temperature spike. The most recent temperature declines have now apparently completely offset that 1998 increase, leaving the satellite record with no net increase in global temperature for the past 30 years—or maybe even a slight decline.

As I said, whenever CON$ are caught lying they just keep on lying. As I have already posted, only the cooked UAH satellite data showed no warming. Christy and Spencer accomplished this by using the opposite sign for correcting diurnal satellite drift. After the correct sign was used even the UAH data shows warming and matches the ground measurements, and Christy even admitted it in the below report he co-authored.

http://www.climatescience.gov/Library/sap/sap1-1/finalreport/sap1-1-final-execsum.pdf

Previously reported discrepancies between the amount of warming
near the surface and higher in the atmosphere have been used to
challenge the reliability of climate models and the reality of humaninduced
global warming. Specifically, surface data showed substantial
global-average warming, while early versions of satellite and radiosonde
data showed little or no warming above the surface. This significant
discrepancy no longer exists because errors in the satellite and
radiosonde data have been identified and corrected.
New data sets
have also been developed that do not show such discrepancies.

Satellite_Temperatures.png


+

But far more reliable and relevant is the satellite data on atmospheric temperatures, which is not distorted by the location, coverage, and surrounding activities of land-based weather stations (highly unreliable outside the U.S. and Europe). The satellite data starts in 1979 and shows no increase in global temperature trends until 1998, when the El Niño that year caused a sharp temperature spike. The most recent temperature declines have now apparently completely offset that 1998 increase, leaving the satellite record with no net increase in global temperature for the past 30 years—or maybe even a slight decline.

Global temperatures were also warmer than today during the Medieval Warm Period, a period of several hundred years around 1000 AD. Even higher temperatures prevailed during a period known as the Holocene Climate Optimum, which ran roughly from 8,000 years ago (6000 BC) to 4,000 years ago (2000 BC). In fact, temperatures were higher than today during most of the period from 9000 BC to the birth of Christ. Yet there was no significant human burning of fossil fuels during these periods.


...ALL SCIENTISTS AGRE that if man-made global warming is real, it would leave a fingerprint in the form of temperatures increasing with altitude in the tropical troposphere portion of the atmosphere up to a hotspot about 10 kilometers above the surface, reflecting the pattern of CO2 and other greenhouse gases in the atmosphere. Warming due to solar variations or other natural causes would not leave such a fingerprint pattern. Recently, higherquality temperature data from balloons and satellites now enables us to settle the man-made global warming debate definitively.

The data from weather balloons shows the opposite pattern: no increasing warming with altitude, but rather a slight cooling, with no hotspot. The satellite data shows the same result: no increasing temperature with altitude, no hotspot, no fingerprint, maybe again a slight cooling with altitude. Game over. QED. The global warming empire is rattling around but has not and cannot come up with an effective response. The data is the data. The science is the science. Man-made global warming is a hoax developed to serve powerful special interests.


Full article here:


The American Spectator : Why the World Is Getting Warmer, Even Though It Is Getting Colder
You prove my point. Thank you.
 
+
Britain facing one of the coldest winters in 100 years, experts predict

Britain is bracing itself for one of the coldest winters for a century with temperatures hitting minus 16 degrees Celsius, forecasters have warned.

They predicted no let up in the freezing snap until at least mid-January, with snow, ice and severe frosts dominating.

And the likelihood is that the second half of the month will be even colder....

____


Britain facing one of the coldest winters in 100 years, experts predict - Telegraph
 
the difference with today is there are more measuring stations today than in 1880, hence the greater margin of error for the 1880s.

Understatement of the New Decade... :clap2:

Now tell me about how Denver and other Urban Areas have Changed since the 1880's regarding Temperature Readings?...

Not just the Number of Readings... That's a Fucking Given.

:)

peace...
I've already answered your dodge. If you want another dodge, you have to explain how the last decade could be warmer than the previous decade if warming stopped 11 years ago.

The oceans have warmed, and the land has warmed whether measured by satellites or ground stations. There are no heat islands in the ocean or in satellite readings, so you can't use the urban heat islands canard.

Assuming your Data (and I haven't seen it) isn't Warped by the WANT that there is Warming as has been Illustrated by some of the "Experts" recently, what is 11 Years in Relation to this Planet's Existence?...

And then tell me about Cycles...

:)

peace...
Well, if you want to use cycles as a dodge, the natural cycle of Ice Age and interglacial warm period says we should be well into the next Ice Age, so this 100 year warming period is outside the natural cycle.
 
On Wednesday, scientists from the National Oceanic and Atmospheric Administration released a new report that said there was greater certainty that aerosols -- the material more commonly known as "haze," the tiny airborne particles from pollution and burning of biomass -- are leading to a net cooling of the atmosphere that is in competition the green house gases causing warming.

Today, NOAA's climate arm, the National Climatic Data Center in Asheville, N.C., announced that the average June-August 2009 summer temperature for the contiguous United States was below average -- the 34th coolest on record.

The preliminary analysis is based on records dating back to 1895.


Summer 2009 colder than normal, NOAA says | Metro - cleveland.com - cleveland.com
 
Guest post by Richard Keen, Ph.D.

To paraphrase Led Zeppelin, “It’s been cooling, I ain’t fooing…”

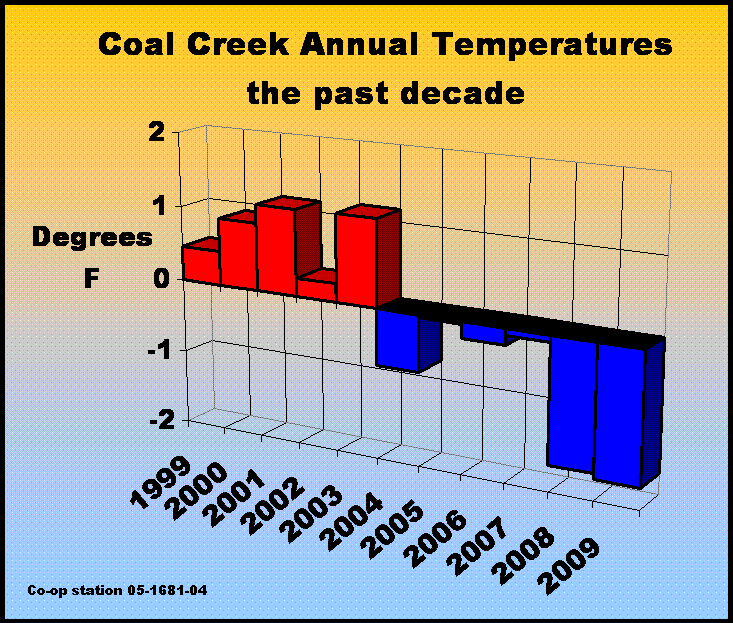
December was a chilly month across much of the U.S., and at my site (the NWS co-op station for Coal Creek Canyon, Colorado, NW of Denver at an elevation 8950 feet, or 720 millibars, December was the coldest December (and the coldest month of any name) in 27 years of record. The average of 16.5 was 0.8 degrees colder than December 1983. Over the entire record, nine months averaged colder than 20F; of these, five occurred during 1983-1990, none during 1991-2005, and four during 2007-2009. It appears that he warm spell of the 1990’s and early 2000’s has ended.

Here’s a chart of the past decade of annual temperatures


coalcreekco2009.gif


http://wattsupwiththat.com/2010/01/04/coal-creek-redux/
 
According to the IPCC models, greenhouse gas warming should be greatest over continental interiors and in the middle troposphere, so Coal Creek Canyon is an ideal “global warming” monitoring site. How, then, is the projected 0.7F per decade warming coming along?

Since 1985, the overall trend has been +0.3F per decade, about half of the IPCC projection. Since 2000, the trend has been -3F per decade – four times greater than the IPCC projection, and in the opposite direction!

This is an example of how one station’s data can be significant for assessing climate change, but only if the station is carefully installed and maintained, is in a location relatively free of non-climatic influences, has records that are diligently kept, and, above all, does not have its records mysteriously altered. It would be instructive to see records from other observers who have quality records of long duration.

Richard Keen, Ph.D.

Coal Creek Canyon, Colorado


Coal Creek Redux « Watts Up With That?
 
Yaaaawwwwnnnnnn.

So we are set for a really cold winter. So what. The climate change fanatics will once again make something out of nothing and governments will rub their hands with glee as they see more opportunity to impose the con of green taxes to fill their depleted coffers.

Climate change is not a new phenomena in the history of the last thousand years. There has always been catastrophic weather from time to time. People have always been afraid of it, and remembered it. The last time the Thames froze over was in 1963 and it has frozen over many times prior to that. It's what weather does!
 
According to the IPCC models, greenhouse gas warming should be greatest over continental interiors and in the middle troposphere, so Coal Creek Canyon is an ideal “global warming” monitoring site. How, then, is the projected 0.7F per decade warming coming along?

Since 1985, the overall trend has been +0.3F per decade, about half of the IPCC projection. Since 2000, the trend has been -3F per decade – four times greater than the IPCC projection, and in the opposite direction!

This is an example of how one station’s data can be significant for assessing climate change, but only if the station is carefully installed and maintained, is in a location relatively free of non-climatic influences, has records that are diligently kept, and, above all, does not have its records mysteriously altered. It would be instructive to see records from other observers who have quality records of long duration.

Richard Keen, Ph.D.

Coal Creek Canyon, Colorado


Coal Creek Redux « Watts Up With That?

I Live in Colorado... It's Fuckin' Cold!

:)

peace...
 

Forum List

Back
Top