Arctic Weather Map
4 Cardinal Points today. Let's check the Ice melt!
Barrow -2F
Eureka -22F
Vize -9F
Kotel -27F
We're having a heat wave...
Hey Frank -- it's getting kinda warm in Barrow for this time of year. You scared bro' ??
Follow along with the video below to see how to install our site as a web app on your home screen.

Note: This feature currently requires accessing the site using the built-in Safari browser.
Arctic Weather Map
4 Cardinal Points today. Let's check the Ice melt!
Barrow -2F
Eureka -22F
Vize -9F
Kotel -27F
We're having a heat wave...
Arctic Weather Map
4 Cardinal Points today. Let's check the Ice melt!
Barrow -2F
Eureka -22F
Vize -9F
Kotel -27F
We're having a heat wave...
Hey Frank -- it's getting kinda warm in Barrow for this time of year. You scared bro' ??
Arctic Weather Map
4 Cardinal Points today. Let's check the Ice melt!
Barrow -2F
Eureka -22F
Vize -9F
Kotel -27F
We're having a heat wave...
Hey Frank -- it's getting kinda warm in Barrow for this time of year. You scared bro' ??
It was -24F yesterday, at the current rate of warming it will be over 150F by Christmas
Arctic Weather Map
4 Cardinal Points today. Let's check the Ice melt!
Barrow -8F
Eureka -20F
Vize 10F
Kotel -27F
We're having a heat wave...a tropical heat wave.
Old Rocks can you please point to the scary red areas in your fake news globe?
well it isn't hard to do, I mean, no sun no heat. So, to come in here and say it's warming is hilarious.Arctic Weather Map
4 Cardinal Points today. Let's check the Ice melt!
Barrow -8F
Eureka -20F
Vize 10F
Kotel -27F
We're having a heat wave...a tropical heat wave.
Old Rocks can you please point to the scary red areas in your fake news globe?
You scared him away from all those low Alaskan, arctic temperatures, he is shivering in fear right now.

Out come the crayons...right on cue.

Out come the crayons...right on cue.
Out come the crayons...right on cue.
Do you have a single shred of evidence that the data Old Rocks and I have presented are false?
Out come the crayons...right on cue.
Do you have a single shred of evidence that the data Old Rocks and I have presented are false?
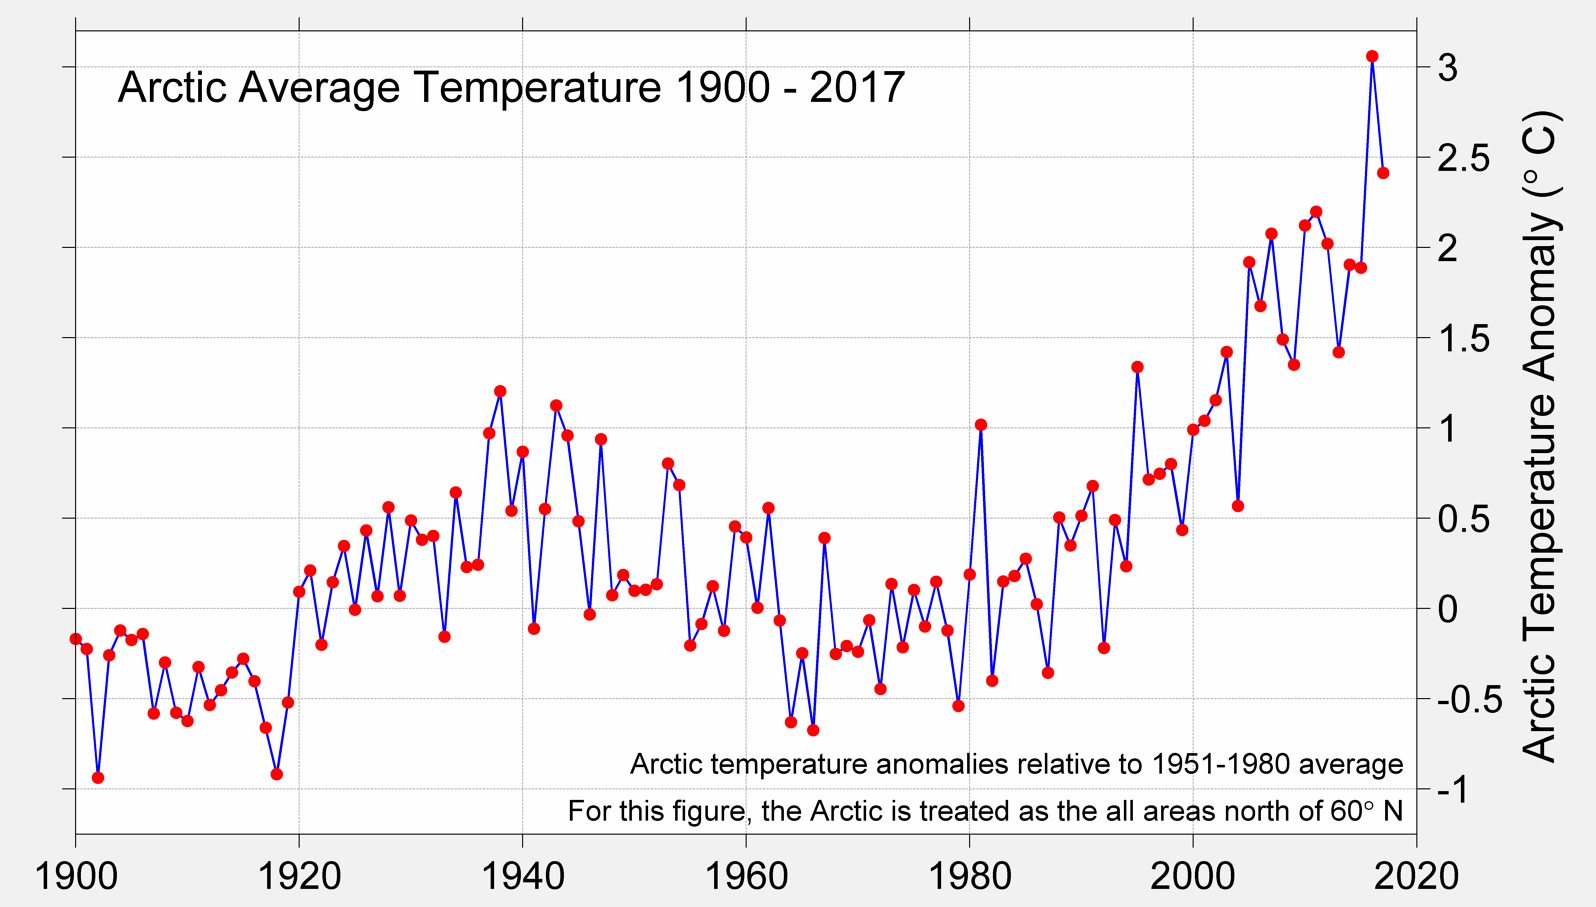
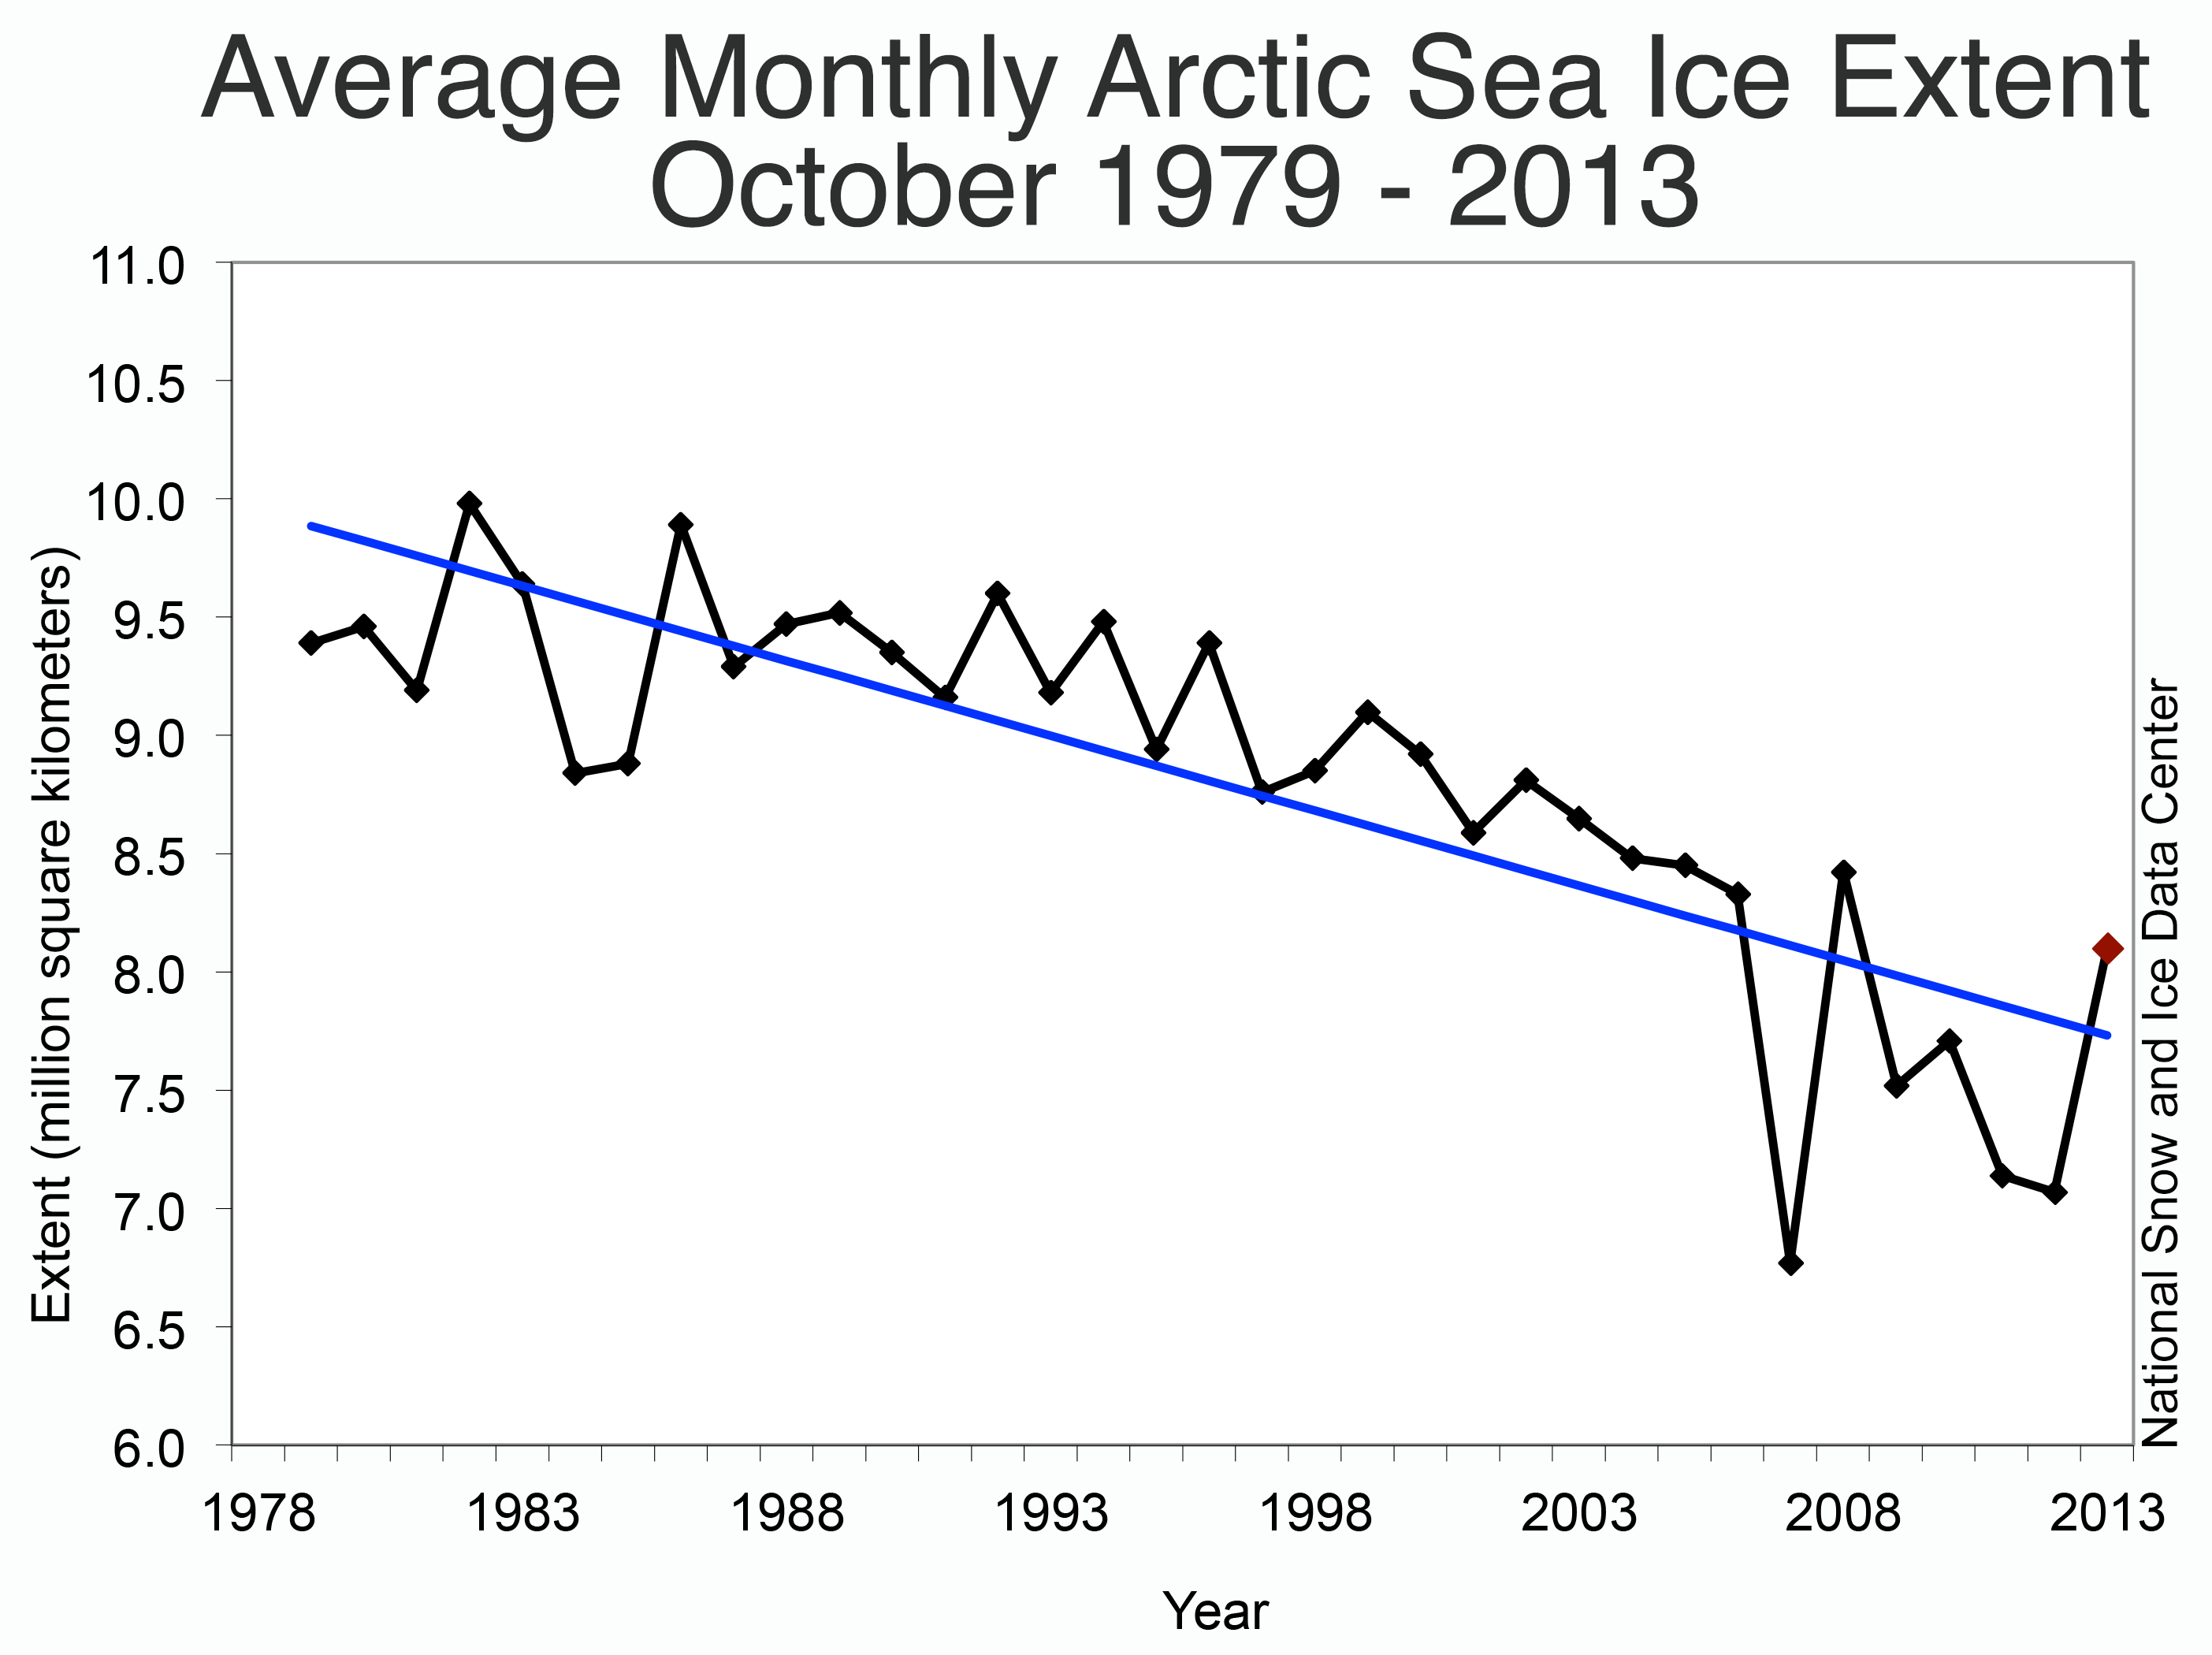
are you saying it gets above freezing without sun?Frank, the graph shows time periods below freezing. No one is claiming that it never gets below freezing. Are you really as stupid as your posts indicate? Again, note that the most recent temperature data show significantly higher values than the baseline. The Arctic is getting warmer. Dramatically.