- May 20, 2009
- 144,099
- 66,367
- 2,330
Posting daily actual temperature that make it very difficult to see how ice could possibly be melting is a threat to your fictional narrative, altered data and temperature models.
Follow along with the video below to see how to install our site as a web app on your home screen.

Note: This feature currently requires accessing the site using the built-in Safari browser.
Why do you find it acceptable to be so blatantly dishonest?
A 5-year old child would understand this Frank. You can spell and operate a computer. I have to assume that you are smarter than you are trying to appear. Water freezes in the winter and melts in the summer. Got that Frank? What happens if it freezes more than it melts? The ice would increase. What happens if it melts more than it freezes? The ice would decrease. Well, Frank, it has been melting more than it has been freezing at least since 1979 (the start of satellite data). The ice cap has been decreasing.
A 5-year old child would understand this Frank. You can spell and operate a computer. I have to assume that you are smarter than you are trying to appear. Water freezes in the winter and melts in the summer. Got that Frank? What happens if it freezes more than it melts? The ice would increase. What happens if it melts more than it freezes? The ice would decrease. Well, Frank, it has been melting more than it has been freezing at least since 1979 (the start of satellite data). The ice cap has been decreasing.
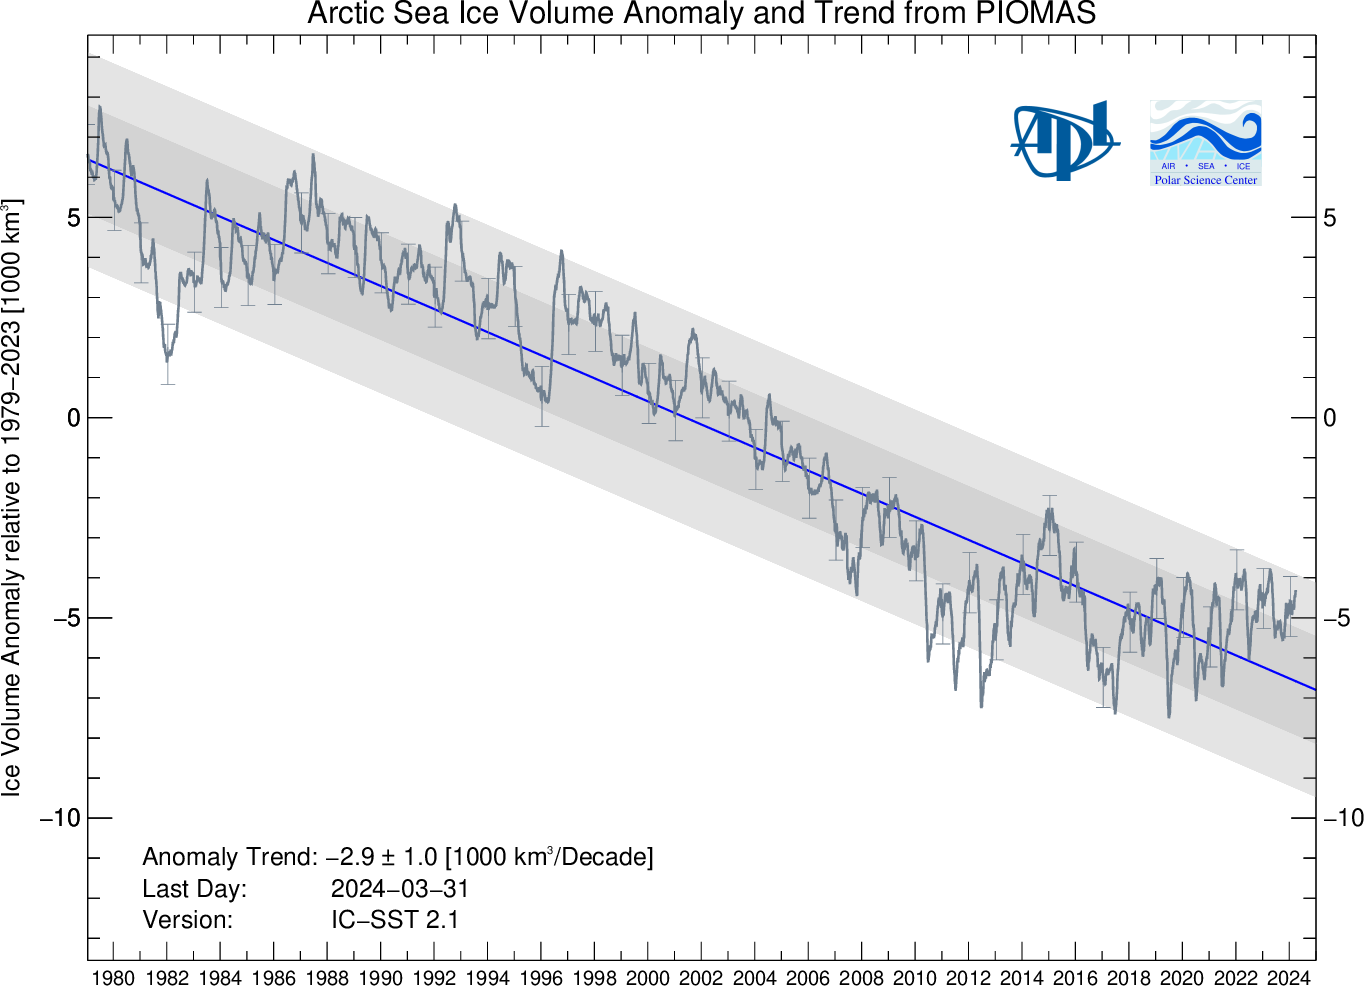
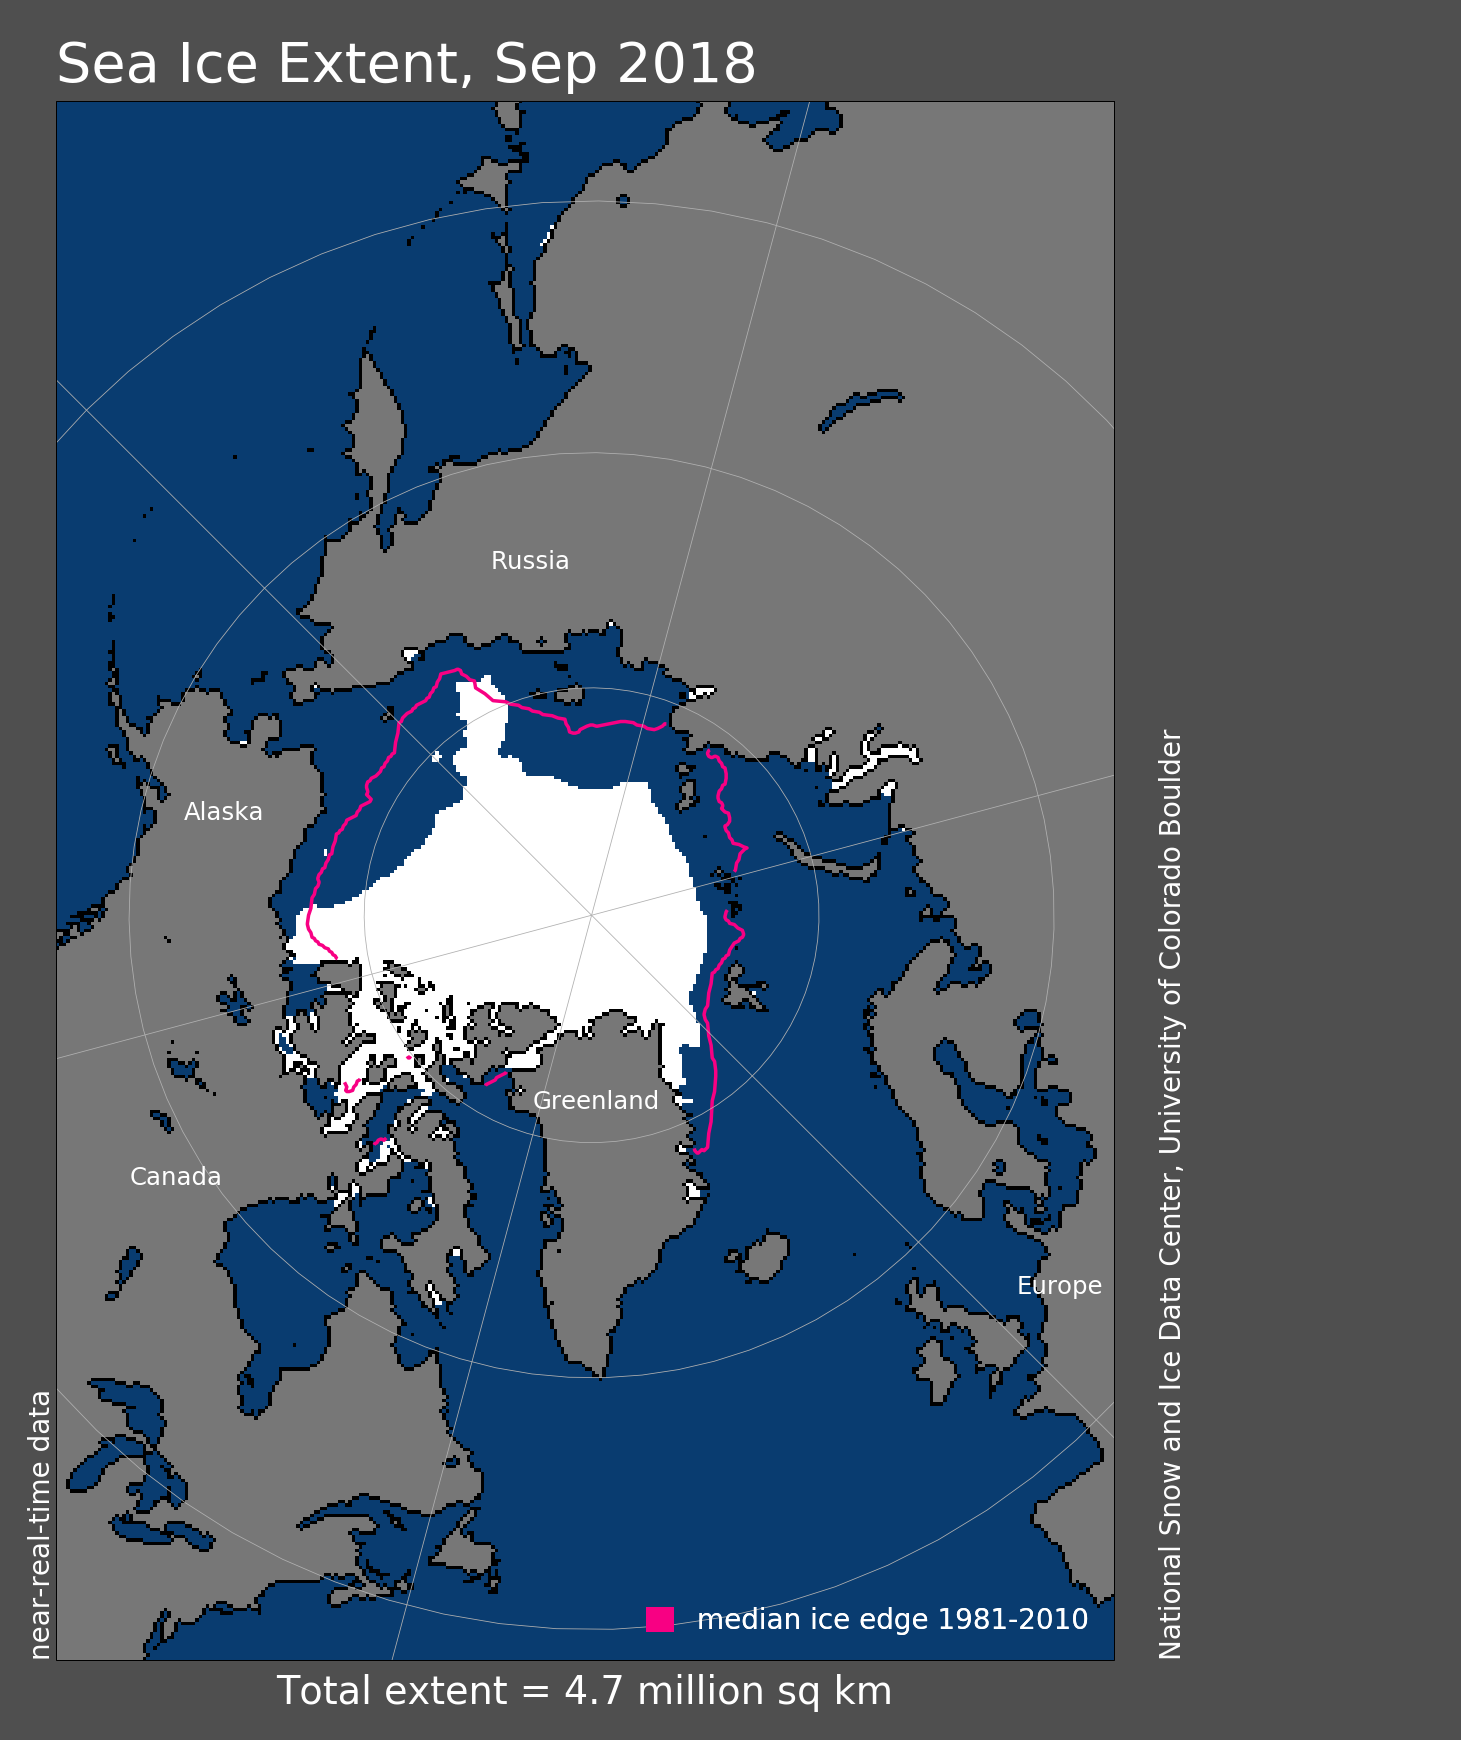
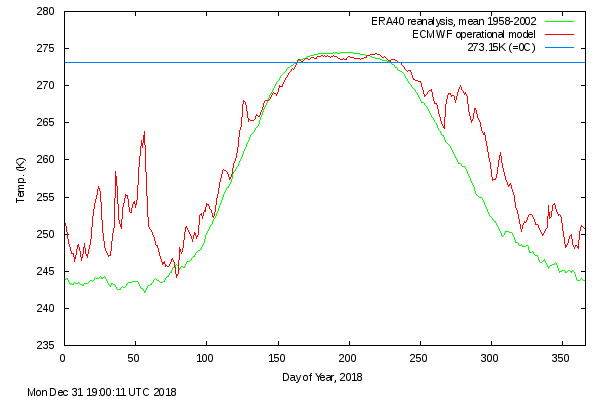

You have been shown that the ice extent and volume have cycled up and down for the entire record. There are several periods one could cherry pick and claim the decline has stopped, but it hasn't. The temperature data certainly give you no reason to believe the decline has stopped.
Less melting this year, but a great deal less freezing as well.
Whoa, fool. It's increasing no where near the rate it increased between 1981 and 1987. What happened? Jesus, your desperation is starting to make me cringe.
Speaking of fools.. The fool posts and fails to recognize a change in average after a long bottom out... Obviously you have no concept how a sign wave looks or how the climatic response is normal and natural..Whoa, fool. It's increasing no where near the rate it increased between 1981 and 1987. What happened? Jesus, your desperation is starting to make me cringe.