3,330 Meters Is Reached!!!(west antarctic ice core)

ScienceRocks

Democrat all the way!
Mar 16, 2010
59,455
6,793
1,900
The Good insane United states of America
3,330 Meters Is Reached!!!
[Heidi Roop]
January 27, 2011
WAIS Divide Ice Core
Dear WAIS Divide Enthusiast -

We are ELATED to pass along the fantastic news that the WAIS Divide Ice Core project has reached its goal this year of drilling 3,330 meters into the West Antarctic Ice Sheet. We just received notice from the camp that this goal was achieved at 12:24 PM on January 28, 2011 local time (6:24 PM, January 27, 2011 EST), with a final borehole depth of 3,329.956 meters. This is the second deepest ice core ever collected and could not have been achieved without the resources, dedication, commitment, perseverance and comradely of hundreds of people.

We at the WAIS Divide Science Coordination Office, on behalf of the science community, want to sincerely thank everyone for their help and support in recovering this monumental ice core. Without you, we wouldn't be at this point today. Please join us now in a toast celebrating this historic accomplishment!

Cheers,

Ken Taylor - Chief Scientist (and currently at WAIS Divide)
Mark Twickler
Joe Souney


Good news...New data to add to our understanding is coming.:tongue:
 
Granny says if it all melts, we all gonna drown...
:eusa_eh:
Antarctic ice volume measured
8 March 2013 - Scientists have their best measure yet for the amount of ice in Antarctica.
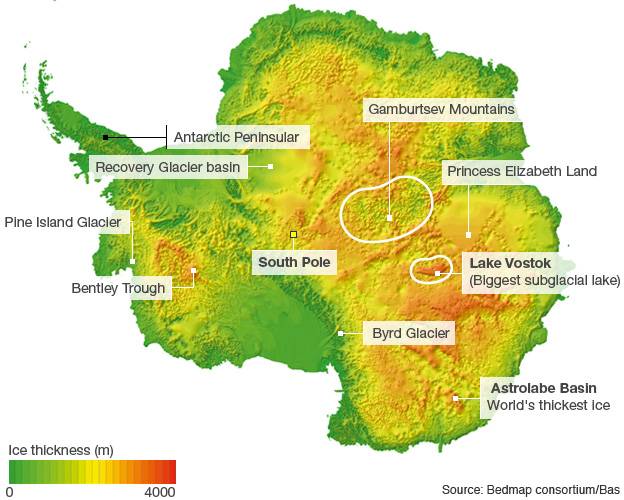
A detailed analysis of data compiled during 50 years of exploration shows the White Continent to contain about 26-and-a-half-million cubic km. It is a colossal volume, and to put that in some sort of context: if this ice was all converted to liquid water, it would be sufficient to raise the height of the world's oceans by 58m. These numbers come out of an international project known as Bedmap2. This large cooperative effort - involving 60 scientists from 35 institutions based in 14 countries - has sought to put tighter constraints on some of Antarctica's fundamental statistics. Bedmap2's new figure for the volume of ice is 4.5% more than previously thought.

antarctic_ice_2.jpg


Interestingly, the sea-level-rise equivalent is not that different to past estimates. This is because the extra ice is shown to lie mostly below the current water line and so if it melted it would not add significantly to the volume already displaced. One way to display all this information is in the thickness map seen at the top of this page. It neatly illustrates the vast scale of the ice sheet covering Antarctica. The thickest point is in a place called Astrolabe Subglacial Basin. There, the column of ice is 4,776m thick. In principle, the above map is simple enough to render provided you know the shape of the continent's rock bed and the height of the overlying ice. You subtract one from the other.

_66268186_66268185.jpg

Radar can be used to map mountains buried under hundreds of metres of ice

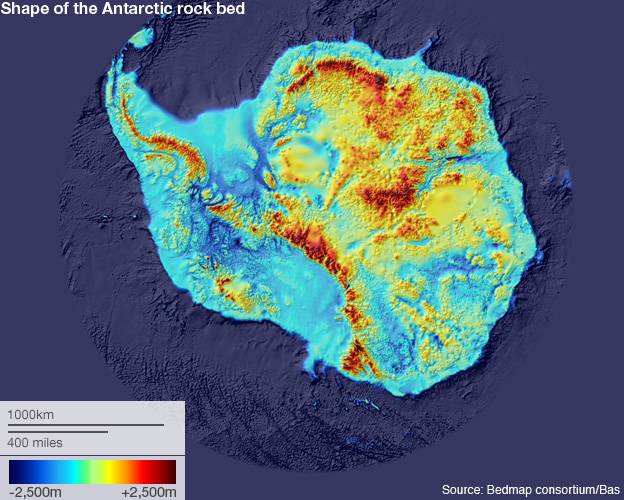
Satellites in recent years have vastly improved our understanding of ice elevation, but visualising the rock underbelly of Antarctica has been a herculean endeavour spread over five decades. "A multitude of different types of data have been used to construct the sub-ice surface," said Peter Fretwell from the British Antarctic Survey (BAS), which is part of the Bedmap Consortium. "These include: radio-echo sounding data from airborne and ground based sources, seismic surveys, swath and gridded bathymetric data, satellite elevation data, pre-gridded elevation datasets, contour data from rock outcrops, glacier profiles, grounding lines and visual interpretation of the ice sheet-ice shelf interface. "The ice thickness model alone uses 25 million individual survey points," he told BBC News.

_66268160_antarctic_1_no_labels.jpg

Getting an accurate visualisation of the rock bed has taken more than five decades

The Bedmap project is in its second iteration, and its numbers for Antarctic ice, published in The Cryosphere journal, are an update on what was the state of knowledge in 2001. It is essential baseline information for anyone trying to model the White Continent's response to future climate change. In comparison to Bedmap1, the total volume of ice calculated for Bedmap2 has risen by 1.2 million cu km to 26.54 million cu km. If you include the floating shelves of ice that jut out into the ocean, the total is very nearly 27 million cu km. But from the new data available to Bedmap2, it is now clear the mean elevation of the rock bed is substantially lower than was understood previously - down from 155m to 95m above sea level. This is the explanation for why most of that extra ice volume (much of it in East Antarctica) is known to lie under water. The whole ice sheet is sitting lower than we thought.

More BBC News - Antarctic ice volume measured
 
I understand that many think that ice cores are a bad way to understand the climate of 100s of thousands of years ago, but if not them then what would be a better tool to use.

I think they are valuable, and it is certainly an idea worth pursuing. Unsurprisingly, the only people taking an anti-science position on this seem to be doing so purely for political reasons.

Why not conduct the research and see what we find?
 
Prob'ly due to hydraulic pressure of meltwater under ice...

Scientists Explore Mystery of Antarctica’s Rising
May 28th, 2014 ~ An altered Antarctic landscape is one of the rarely discussed side effects of accelerated ice melting.
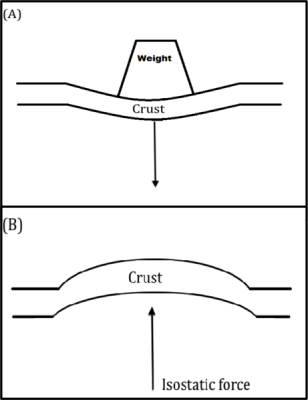
For years as the ice grew in Antarctica, its weight compressed the ground beneath it. But when the ice melted and this weight was reduced, the ground sprang back, rebounding over time. However, the ground in the Northern Antarctic Peninsula is rebounding at a faster rate than the elastic response of the lighter weight load should allow. An international team of researchers, led by scientists at the UK’s Newcastle University, found that over the past year, the land in that area of the Antarctic has risen 15 millimeters.

Antartic-Peninsula-Landscape-640x202.jpg

The Antarctic Peninsula

Models created for the study have predicted that this rate could get as high as 45 millimeters per year, according to Peter Clarke of Newcastle University, one of the authors of the study. The land rise in nearby areas was less than a millimeter each year. Now Clarke and his colleagues think they know what might be causing the rapid ground rise. As explained in the journal Earth and Planetary Science Letters, the research team found that the Earth’s mantle, hundreds of kilometers beneath the surface, is flowing about 1,000 times faster than was thought possible, which in turn is allowing the land above to move upward at a faster rate. The researchers think that the increased flow of the mantle may be due to some chemical or temperature changes brought on by the ice melt.

461px-Isostatic_rebound-308x400.png

A simple drawing illustrating the elastic response of the ground following the removal of large amount of weight generated by objects such as a glacial ice sheet.

To reach their findings, Clarke and the team brought together a wide variety of different data sets from scientific GPS receivers, which are much more precise than those people use in their cars. The GPS devices measured movements of the solid Earth within millimeters or less than millimeters per year. In studying the GPS data for the North Antarctic Peninsula, the researchers noticed that the Earth was uplifting at a rate faster than they thought was possible. After making this finding, the research team studied data gathered by NASA’s ICESat – Ice, Cloud, and land Elevation Satellite, which has a laser pointing downward from the satellite that measured the height of the ice sheet in the region.

larsenb_tmo_20020217.jpg

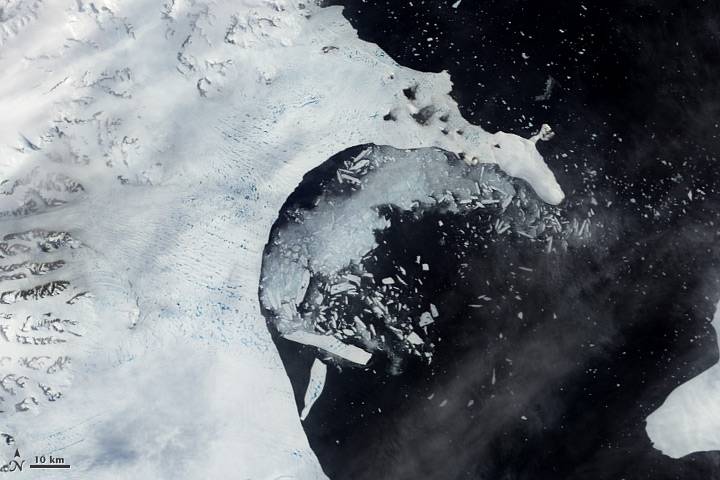
In early 2002, the Larsen B Ice Shelf, in the northern Antarctic Peninsula, collapsed in just over one month. This image taken by NASA on Feb. 17, 2002, shows fragments of the ice shelf floating in the Weddell Sea.

Those measurements showed that the ice sheets, since the collapse of the Larsen-B Ice Shelf in 2002, were losing their ice in a few places at a rate of tens of meters per year. To reach their conclusions, the researchers took the results from both the GPS and ICESat data studies and combined them into a mathematical model that showed how the Earth should respond to the change in the weight of the ice. “The significant thing is that this part of the Antarctic Peninsula is behaving so differently to what we think is true for the rest of the Antarctic and indeed the rest of the world,” said Clarke. “And this is going to have an implication for the way in which we can use measurements of the ice height and the gravity field of the Earth in order to monitor the changes in the ice sheet in the future.”

Scientists Explore Mystery of Antarctica?s Rising « Science World
 
3,330 meters.....holy fuck??!! Who knew??!!

No wonder the k00ks only want to talk about the arctic ice and this little tiny area of Antarctica where there is some melt.


ghey


More evidence of the hoax being a hoax.
 

Forum List

Back
Top