2013 sea ice thread!!!

Egad, the dumb fucks cannot tell the differance in scale!

I see that you can't tell the difference between alarmist tactics and simple scientific reporting of the facts either. Not surprising in the least.
 
Now use the slider bar at the bottom and run this from 1979 to present. Notice that prior to 1996 the line is mostly above the zero line, with only an occasional dip to -1. From 1996 to 2002, it is about centered on the zero line. From 2002 on, it is mostly below the zero line, with dips down to -2.5. A very definate downward trend.

http://arctic.atmos.uiuc.edu/cryosphere/IMAGES/global.daily.ice.area.withtrend.jpg

So where are these imaginary "wider and wider swings with an overall warming trend" you keep telling us about

"wider and wider swings with an overall warming trend"? What is it that you think you are talking about? "wider and wider swings" of what? The swing set in your backyard?

Ask rocks, he is the one preaching about them all the time.
 
Scientists zero in on Arctic, hemisphere-wide climate swings

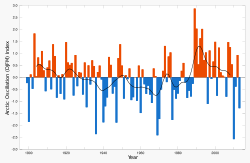
Arctic Oscillation explains the warming observed in the Arctic better than anything else

some studies indicating that the recent trend in the Arctic Oscillation results partly from human activities that generate greenhouse gases and sulfate particles, and deplete stratospheric ozone.

Thus climate modelers have redoubled their efforts to determine the physics behind the patterns of change. Although their models portray realistic day-to-day and month-to-month variations in the Arctic Oscillation, they fail to capture the magnitude of the longer term trend in the Arctic Oscillation that was observed from 1970 to 2000. While paleoclimatologists studying the climate record of the past 1,000 years have not reached a consensus on the importance of the Arctic Oscillation pattern over this longer period, some surprising findings indicate that past Arctic warmings tended to coincide with low-frequency El Nino-Southern Oscillation events in the tropical Pacific.

Arctic oscillation - Wikipedia, the free encyclopedia

250px-Arctic_Oscillation.svg.png
 
New satellite data measures Arctic sea ice volume at record low

"Latest observations on Arctic sea ice from the European Space Agency’s (ESA) Cryosat mission, presented at a symposium in Edinburgh, Scotland, last week, reveal a new record low volume of sea ice in the northern polar region."

"the latest measurements on Arctic sea ice volumes reinforce historical data on Arctic sea ice melt"

Presenting figures at the Living Planet Symposium in Edinburgh last week, Andrew Shepherd, Professor of Earth Observation at the School of Earth and the Environment at Leeds University, UK told delegates,
“CryoSat continues to provide clear evidence of diminishing Arctic sea ice.”

Professor Shepherd continued,
“From the satellite’s measurements we can see that some parts of the ice pack ice have thinned more rapidly than others, but there has been a decrease in the volume of winter and summer ice over the past three years.”

The professor added,
“The volume of the sea ice at the end of last winter was less than 15,000 cubic kilometers, which is lower than any other year going into summer and indicates less winter growth than usual.”
 
A Reconciled Estimate of Ice-Sheet Mass Balance

We combined an ensemble of satellite altimetry, interferometry, and gravimetry data sets using common geographical regions, time intervals, and models of surface mass balance and glacial isostatic adjustment to estimate the mass balance of Earth’s polar ice sheets. We find that there is good agreement between different satellite methods—especially in Greenland and West Antarctica—and that combining satellite data sets leads to greater certainty. Between 1992 and 2011, the ice sheets of Greenland, East Antarctica, West Antarctica, and the Antarctic Peninsula changed in mass by –142 ± 49, +14 ± 43, –65 ± 26, and –20 ± 14 gigatonnes year−1, respectively. Since 1992, the polar ice sheets have contributed, on average, 0.59 ± 0.20 millimeter year−1 to the rate of global sea-level rise.
 
The summary of the related article

GLACIOLOGY

Experts Agree Global Warming Is Melting the World Rapidly

Richard A. Kerr

Forty-seven glaciologists have arrived at a community consensus over all the data on what the past century's warming has done to the great ice sheets: a current annual loss of 344 billion tons of glacial ice, accounting for 20% of current sea level rise. Greenland's share—about 263 billion tons—is roughly what most researchers expected, but Antarctica's represents the first agreement on a rate that had ranged from a far larger loss to an actual gain. The new analysis, published on page 1183 of this week's issue of Science, also makes it clear that losses from Greenland and West Antarctica have been accelerating, showing that some ice sheets are disconcertingly sensitive to warming.

Experts Agree Global Warming Is Melting the World Rapidly
 
New satellite data measures Arctic sea ice volume at record low

"Latest observations on Arctic sea ice from the European Space Agency’s (ESA) Cryosat mission, presented at a symposium in Edinburgh, Scotland, last week, reveal a new record low volume of sea ice in the northern polar region."

"the latest measurements on Arctic sea ice volumes reinforce historical data on Arctic sea ice melt"

Presenting figures at the Living Planet Symposium in Edinburgh last week, Andrew Shepherd, Professor of Earth Observation at the School of Earth and the Environment at Leeds University, UK told delegates,
“CryoSat continues to provide clear evidence of diminishing Arctic sea ice.”

Professor Shepherd continued,
“From the satellite’s measurements we can see that some parts of the ice pack ice have thinned more rapidly than others, but there has been a decrease in the volume of winter and summer ice over the past three years.”

The professor added,
“The volume of the sea ice at the end of last winter was less than 15,000 cubic kilometers, which is lower than any other year going into summer and indicates less winter growth than usual.”


:lol::lol::lol::lol:


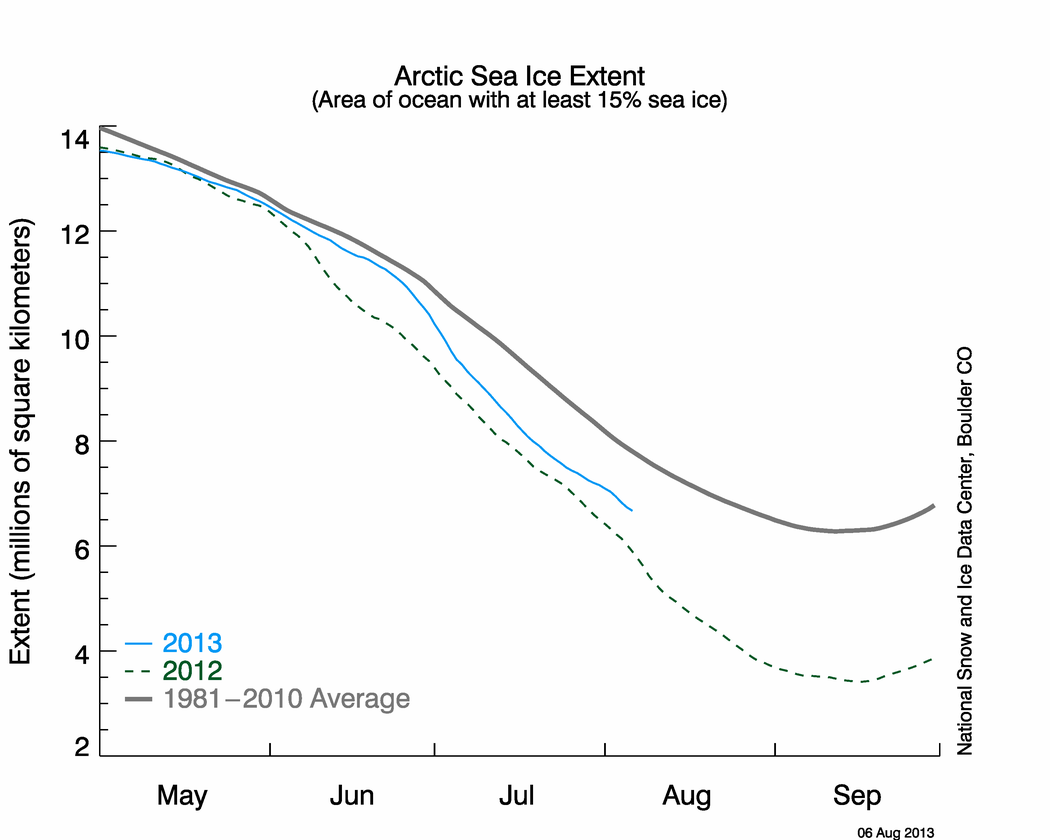
This is what "record low" Arctic sea ice looks like huh? And you guys wonder why you're not taken seriously anymore...

N_timeseries.png


cryo_compare.jpg
 
The man said "volume". You have presented only extents data. Volume, of course, is the more significant parameter. Perhaps it is this sort of thing that has prevented anyone with a basic science education from taking you seriously.

There. I have returned the insult you provided. It makes me feel weak.
 
Last edited:
The man said "volume". You have presented only extents data. Volume, of course, is the more significant parameter. Perhaps it is this sort of thing that has prevented anyone with a basic science education from taking you seriously.

There. I have returned the insult you provided. It makes me feel weak.


Observations on the ground are somewhat different though........... Which is why you should always consult more than ONE source, as anyone with even a passing science education will tell you...

Multi year ice has suffered due to harsh winds driving the multi year ice out to where it could be broken up. Not this year...

"In recent summers, there has been considerable transport of older ice into the Beaufort and Chukchi seas, where it has been broken up and exposed to a warm ocean and high air temperatures. This has been a major factor in the loss of multiyear ice over the last decade. This year was notably different. Because this year’s wind pattern was different than 2012, the multiyear ice largely remained in a compact area along the Canadian Archipelago and did not circulate into the Beaufort and Chukchi seas. The cooler conditions this summer also helped preserve more of the first-year ice through the summer."


Arctic Sea Ice News and Analysis | Sea ice data updated daily with one-day lag
 
Are you suggesting that refutes the observation that volume, as measured by the Cryosat satellite, has continued to decrease?
 
Are you suggesting that refutes the observation that volume, as measured by the Cryosat satellite, has continued to decrease?


Volume is a measurement that is very difficult to obtain from space. They have tried to use the GRACE satellite but the results have been less than stellar as the peer reviewed paper shows. The only volumetric data that is robust enough to be used is actual field data and that is pretty much non-existent. What does exist shows that multi year ice over 4 years old is at its highest level in a few years.


"The two researchers report that the mean ocean mass trends they calculated "vary quite dramatically depending on which GRACE product is used, which adjustments are applied, and how the data are processed." More specifically, they state that "the PGR adjustment ranges from 1 to 2 mm/year, the geocenter adjustment may have biases on the order of 0.2 mm/year, and the atmospheric mass correction may have errors of up to 0.1 mm/year," while "differences between GRACE data centers are quite large, up to 1 mm/year, and differences due to variations in the processing may be up to 0.5 mm/year."


CO2 Science
 
Are you suggesting that refutes the observation that volume, as measured by the Cryosat satellite, has continued to decrease?

Volume is a measurement that is very difficult to obtain from space. They have tried to use the GRACE satellite but the results have been less than stellar as the peer reviewed paper shows. The only volumetric data that is robust enough to be used is actual field data and that is pretty much non-existent. What does exist shows that multi year ice over 4 years old is at its highest level in a few years.


"The two researchers report that the mean ocean mass trends they calculated "vary quite dramatically depending on which GRACE product is used, which adjustments are applied, and how the data are processed." More specifically, they state that "the PGR adjustment ranges from 1 to 2 mm/year, the geocenter adjustment may have biases on the order of 0.2 mm/year, and the atmospheric mass correction may have errors of up to 0.1 mm/year," while "differences between GRACE data centers are quite large, up to 1 mm/year, and differences due to variations in the processing may be up to 0.5 mm/year."

CO2 Science

I suggest that the Cryosat ice volume data is quite robust and has significantly more precision than the data coming from GRACE. Of course, GRACE can be used over land where Cryosat is useless, but I suggest you review the following three sites.

BBC News - Esa's Cryosat mission observes continuing Arctic winter ice decline

NASA Measures Melting Land Ice Volume - GIM Internationalnasa_measures_melting_land_ice_volume.html

GRACE-derived ice-mass variations over Greenland by accounting for leakage effects | CU Sea Level Research Group

I also fail to see in your quoted text where it says "multi year ice over 4 years old is at its highest level in a few years."
 
Last edited:
Are you suggesting that refutes the observation that volume, as measured by the Cryosat satellite, has continued to decrease?

Volume is a measurement that is very difficult to obtain from space. They have tried to use the GRACE satellite but the results have been less than stellar as the peer reviewed paper shows. The only volumetric data that is robust enough to be used is actual field data and that is pretty much non-existent. What does exist shows that multi year ice over 4 years old is at its highest level in a few years.


"The two researchers report that the mean ocean mass trends they calculated "vary quite dramatically depending on which GRACE product is used, which adjustments are applied, and how the data are processed." More specifically, they state that "the PGR adjustment ranges from 1 to 2 mm/year, the geocenter adjustment may have biases on the order of 0.2 mm/year, and the atmospheric mass correction may have errors of up to 0.1 mm/year," while "differences between GRACE data centers are quite large, up to 1 mm/year, and differences due to variations in the processing may be up to 0.5 mm/year."

CO2 Science

I suggest that the Cryosat ice volume data is quite robust and has significantly more precision than the data coming from GRACE. Of course, GRACE can be used over land where Cryosat is useless, but I suggest you review the following three sites.

BBC News - Esa's Cryosat mission observes continuing Arctic winter ice decline

NASA Measures Melting Land Ice Volume - GIM Internationalnasa_measures_melting_land_ice_volume.html

GRACE-derived ice-mass variations over Greenland by accounting for leakage effects | CU Sea Level Research Group

I also fail to see in your quoted text where it says "multi year ice over 4 years old is at its highest level in a few years."


The Cryosat link is useful, but the other two are to GRACE which has already been shown to be useless.
 
Volume is a measurement that is very difficult to obtain from space. They have tried to use the GRACE satellite but the results have been less than stellar as the peer reviewed paper shows. The only volumetric data that is robust enough to be used is actual field data and that is pretty much non-existent. What does exist shows that multi year ice over 4 years old is at its highest level in a few years.


"The two researchers report that the mean ocean mass trends they calculated "vary quite dramatically depending on which GRACE product is used, which adjustments are applied, and how the data are processed." More specifically, they state that "the PGR adjustment ranges from 1 to 2 mm/year, the geocenter adjustment may have biases on the order of 0.2 mm/year, and the atmospheric mass correction may have errors of up to 0.1 mm/year," while "differences between GRACE data centers are quite large, up to 1 mm/year, and differences due to variations in the processing may be up to 0.5 mm/year."

CO2 Science

I suggest that the Cryosat ice volume data is quite robust and has significantly more precision than the data coming from GRACE. Of course, GRACE can be used over land where Cryosat is useless, but I suggest you review the following three sites.

BBC News - Esa's Cryosat mission observes continuing Arctic winter ice decline

NASA Measures Melting Land Ice Volume - GIM Internationalnasa_measures_melting_land_ice_volume.html

GRACE-derived ice-mass variations over Greenland by accounting for leakage effects | CU Sea Level Research Group

I also fail to see in your quoted text where it says "multi year ice over 4 years old is at its highest level in a few years."

The Cryosat link is useful, but the other two are to GRACE which has already been shown to be useless.

Au contraire (or however you spell it). I think the GRACE satellite has real value for land-based ice masses. At least it's better than nothing.

But in any case, I'm glad to hear you approve of the Cryosat data. It shows that Arctic ice volume is continuing to decline.

Do you have a link for the 4-year-old-ice-highest-in-several-years comment? It's okay if you don't. I was just wondering.
 
Last edited:
I suggest that the Cryosat ice volume data is quite robust and has significantly more precision than the data coming from GRACE. Of course, GRACE can be used over land where Cryosat is useless, but I suggest you review the following three sites.

BBC News - Esa's Cryosat mission observes continuing Arctic winter ice decline

NASA Measures Melting Land Ice Volume - GIM Internationalnasa_measures_melting_land_ice_volume.html

GRACE-derived ice-mass variations over Greenland by accounting for leakage effects | CU Sea Level Research Group

I also fail to see in your quoted text where it says "multi year ice over 4 years old is at its highest level in a few years."

The Cryosat link is useful, but the other two are to GRACE which has already been shown to be useless.

Au contraire (or however you spell it). I think the GRACE satellite has real value for land-based ice masses. At least it's better than nothing.

But in any case, I'm glad to hear you approve of the Cryosat data. It shows that Arctic ice volume is continuing to decline.

Do you have a link for the 4-year-old-ice-highest-in-several-years comment? It's okay if you don't. I was just wondering.


The papers say otherwise on the GRACE data for ice volume. Cryosat is a very good beginning but I am concerned how they run the data. I have to find the four year thickness link for you. Look for it in a day or two and if I don't post it remind me.

EDIT: found it!..........


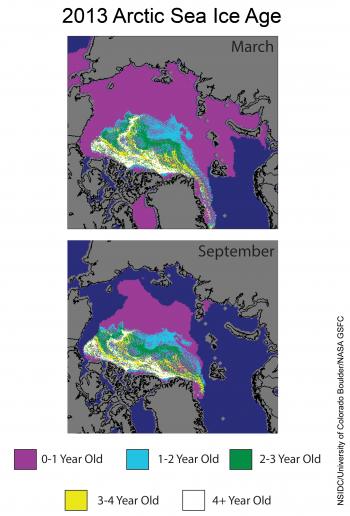
Figure5-350x516.png


http://nsidc.org/arcticseaicenews/2013/10/a-better-year-for-the-cryosphere/
 
Last edited:
The papers say otherwise on the GRACE data for ice volume. Cryosat is a very good beginning but I am concerned how they run the data. I have to find the four year thickness link for you. Look for it in a day or two and if I don't post it remind me.

EDIT: found it!..........


Figure5-350x516.png


A better year for the cryosphere | Arctic Sea Ice News and Analysis

Here is your original statement: "What does exist shows that multi year ice over 4 years old is at its highest level in a few years."

Your graphic shows some ice 4 years and older, but it says nothing in support of your statement.


I suggest you read the link and pay special attention to the section on multi year ice.
 
The pattern of ice thickness for the summer of 2013 is similar to what has been seen in recent years. According to data from the European Space Agency CryoSat-2 radar altimeter, the spring melt season started with an Arctic ice cover thinner than in any recent year. This corroborates thickness information inferred from a calculation of ice age that showed first-year ice, which is thinner and more vulnerable to melt, over a significant part of the Arctic Ocean as the melt season started (see our earlier post). Older, thicker ice remained in a region roughly between the North Pole and the Canadian Archipelago and the Greenland coast.

In recent summers, there has been considerable transport of older ice into the Beaufort and Chukchi seas, where it has been broken up and exposed to a warm ocean and high air temperatures. This has been a major factor in the loss of multiyear ice over the last decade. This year was notably different. Because this year’s wind pattern was different than 2012, the multiyear ice largely remained in a compact area along the Canadian Archipelago and did not circulate into the Beaufort and Chukchi seas. The cooler conditions this summer also helped preserve more of the first-year ice through the summer.

The first-year ice that survived the summer, now defined as second-year ice, will thicken through autumn and winter. However, it would take several more cool years in a row to build the ice cover back to the state it was in during the 1980s, which consisted of a larger proportion of thicker, multiyear ice that was more resistant to melt. While ice in the Arctic will thicken through this autumn and winter, winds may also transport some of the thicker ice out of the Arctic Ocean and into the North Atlantic.
******************************************************
Sorry Man, I still don't see it.


I am always amazed at the contortions that people go to, just so that they don't have to see other points of view. the example of sea ice extent/volume/age is similar to the case of global temperatures. any single year cannot be taken by itself but must be see in context with the year(s) before it.

until recently when 'the pause' was acknowledged, many alarmists like Old Rocks and much of the media were stating that warming was not only continuing but rapidly accelerating. nonsense of course but when I pointed out that they were confusing 'warm' with 'warming', they would simply say that ,"the ten warmest years on record have happened in the last fifteen years, blah, blah, blah". the record 1998 El Nino caused a step change, it reset the thermostat to a higher level. there has only been natural variation around the new setting. it would involve major cooling to bring the global temp back down to older average temps.

sea ice extent had the same '1998 El Nino type moment' in 2007 when storms and conditions managed to blow most of the ice out of the Arctic. if you lose most of the 5 yr ice in a particular year, you cannot get it back for at least 5 yrs! 2012 also had storms and conditions that blew much of the ice out into warmer waters. ice formation is a function of present conditions. total ice and age of ice is a function of past conditions. the air flow patterns and the occurence of particular types of storms are far more important to the summer survival of ice than the surface air temp or even the ocean water temp.


when it comes down to CO2 impact on polar temperatures, the theories are incorrect. the south pole should have the biggest temp spike because CO2 influence is bigger at lower temperatures but Antartica is showing no warming except in the seismically active penninsula and western area which is also impacted by slightly warmer ocean currents. for every piece of evidence that seems to support CO2 theory there are at least as many pieces of counter evidence that are being ignored.
 

Forum List

Back
Top