ScienceRocks
Democrat all the way!
- Banned
- #1
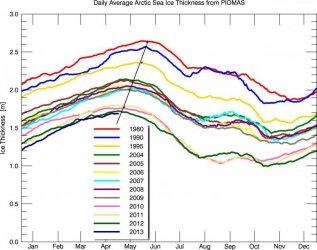
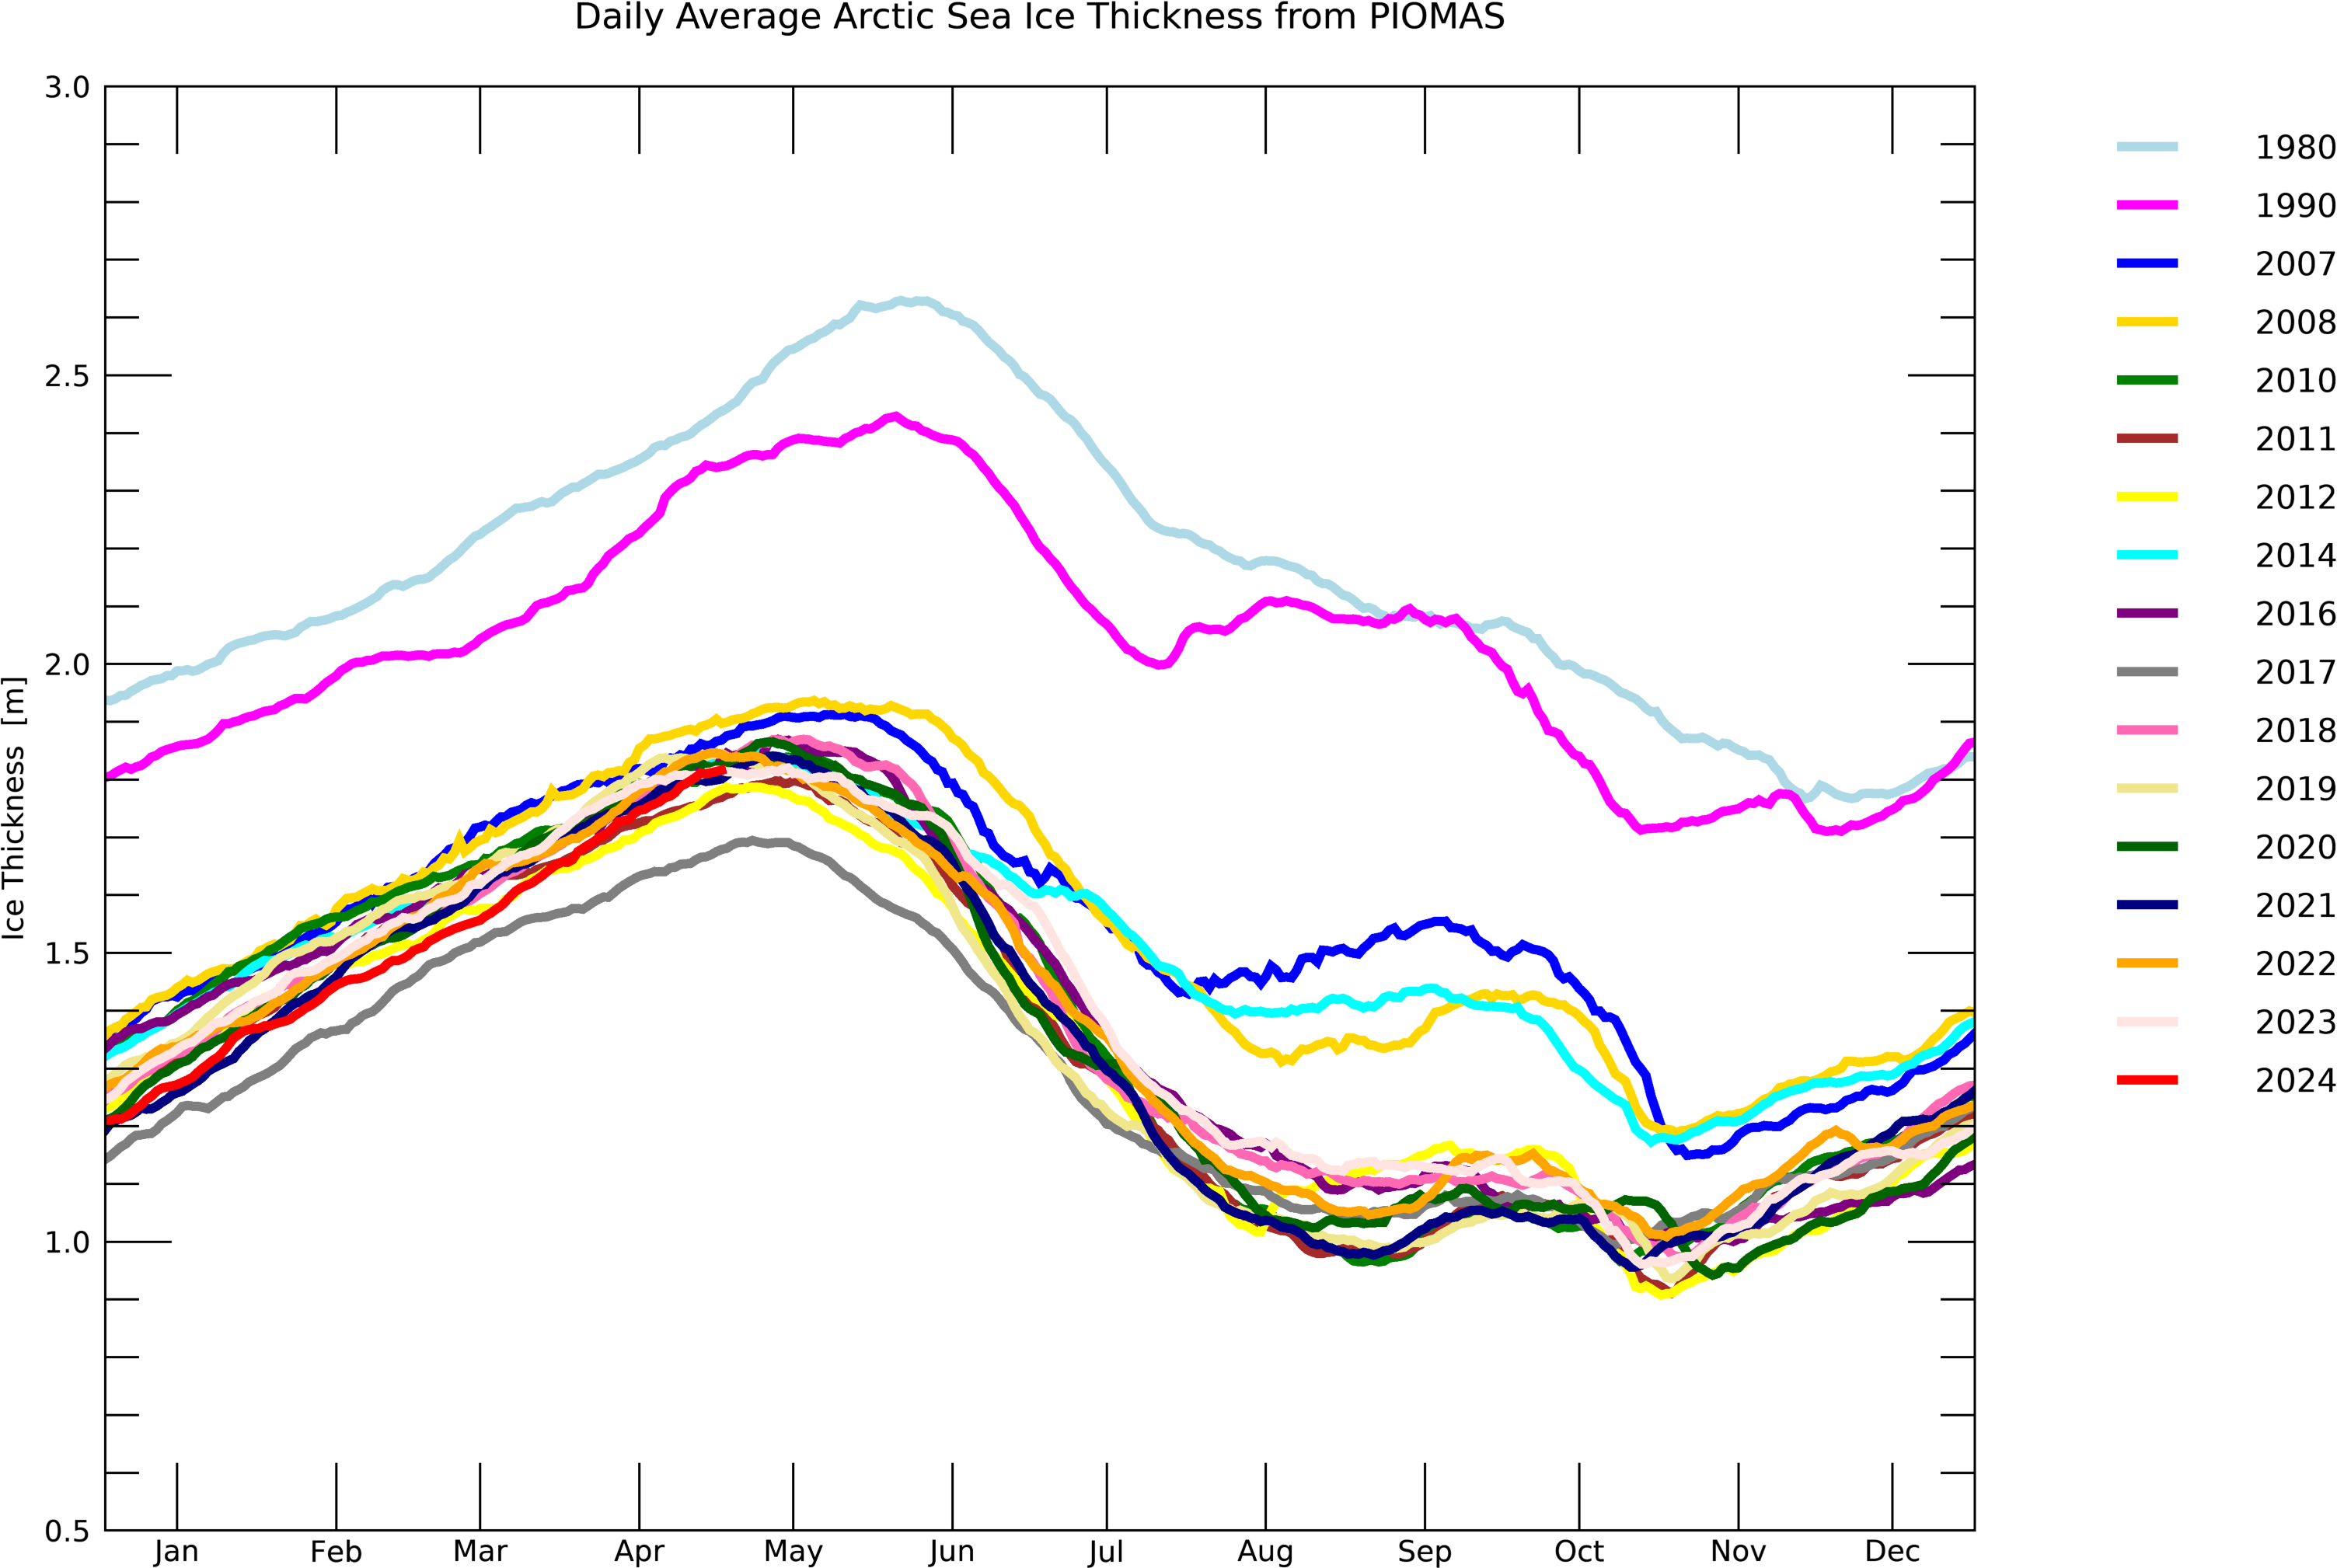
All discussion of Arctic sea ice!!! Let's watch the min!!!
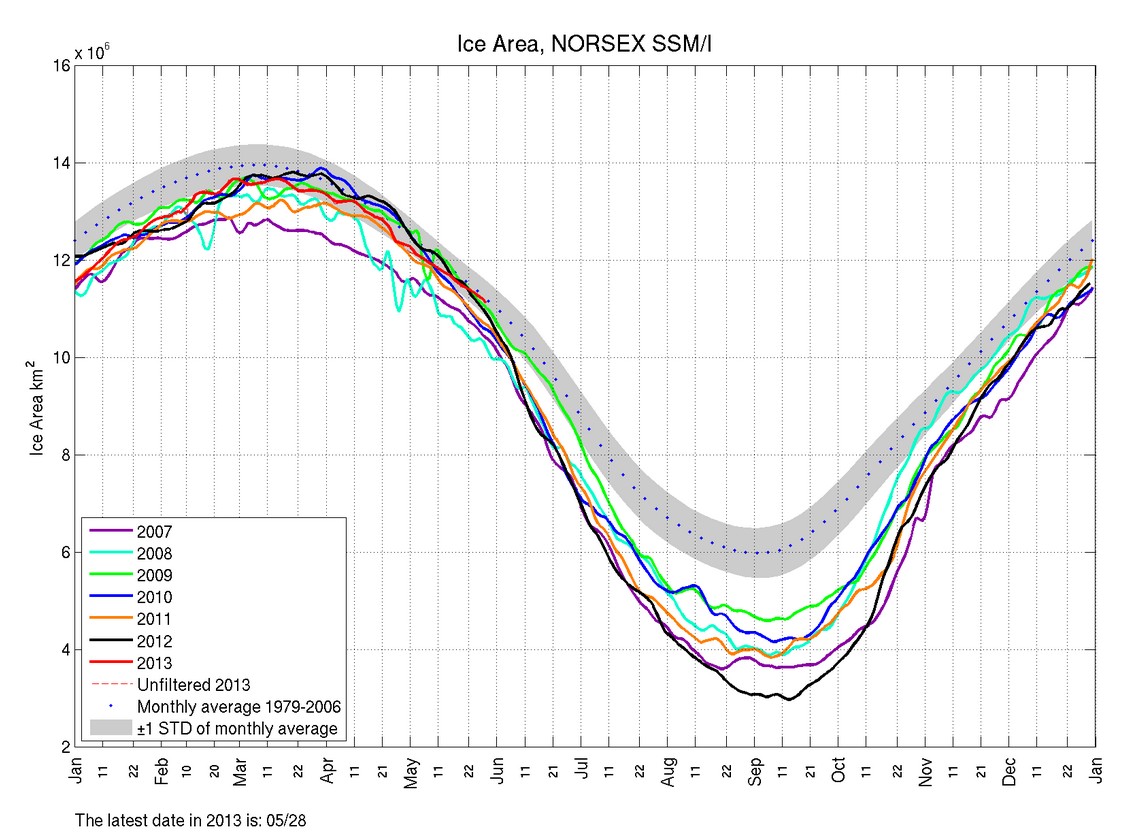
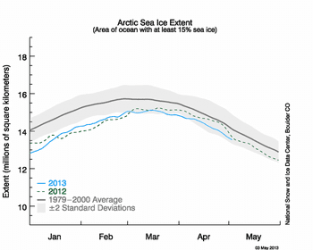
So far we're tracking even below last year!
Arctic Sea Ice News and Analysis | Sea ice data updated daily with one-day lag
So far we're tracking even below last year!
Arctic Sea Ice News and Analysis | Sea ice data updated daily with one-day lag
Attachments
Last edited:


 Like a full month. wow.