2011 global temperature thread

That does not explain why some as you say part's of the earth was way more hotter than it is now.


proxies for temperature, CO2, etc need a lot of manipulation and generalizations therefor the scientists' frame of mind can have a lot of impact on what is concluded for the data. once a general mindset is in place excuses for evidence that contradicts the theory are found and put down as fact even if the excuses would seem unreasonable without the theory for context. just look at the herculean efforts to remove the Midieval Warm Period which would be totally ridiculous except that it helps the AGW cause.
I'm no science wiz but the information I read tells me the earth warms and cools in cycles. We are ending a warming cycle and now entering a cooling cycle

The Midevil warm period lasted 400 years and the roman warm period close to that if not more...We just came out of a little ice age...One of the coldest periods since the younger dyas of 8,500 years ago...I doubt we're quite ready for another cold period...At least like the one we just got out of.

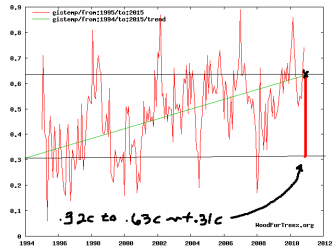
If you look at the chart I used you will see what I mean

lambh23.jpg
 
Matthew- given that there have been warm periods in the past, and we know that CO2 is released by warming oceans, do you think that there is some magical significance to the pre-industrial level of CO2 that is bandied about by AGW alarmists? Do you think that the earth has homeostasis systems in place that work to limit any disruptions, or do you think there are tipping points that we are approaching due to human interference?
 
I'm no science wiz but the information I read tells me the earth warms and cools in cycles. We are ending a warming cycle and now entering a cooling cycle

The Midevil warm period lasted 400 years and the roman warm period close to that if not more...We just came out of a little ice age...One of the coldest periods since the younger dyas of 8,500 years ago...I doubt we're quite ready for another cold period...At least like the one we just got out of.

If you look at the chart I used you will see what I mean

lambh23.jpg


Some people think that the cathederal construction in europe was only possible because of the warm weather which led to good crops and people freed up to do other things. Mind you, others think that the population decrease caused by the Black Plague was the reason for many advancements due to the fact that people could charge more for their labour.
 
Matthew- given that there have been warm periods in the past, and we know that CO2 is released by warming oceans, do you think that there is some magical significance to the pre-industrial level of CO2 that is bandied about by AGW alarmists? Do you think that the earth has homeostasis systems in place that work to limit any disruptions, or do you think there are tipping points that we are approaching due to human interference?

The level of co2 pre-Industrial (1700 and before) at least by the official data was near 270-280 range. There is many factors that keep co2 at near that level during the interglacial periods like we're within...For one carbon sinks of the ocean, forest, and rock wearing that takes in co2. If you believe the official co2 record of the last 800 thousand years it has never not once been this high. Maybe 300 plus 120-150 thousand years ago for a period...You can go back 15 million years to find co2 levels this high. Again if you trust any of the ice cores or anything...During the ice ages the level drops to around 180 ppm because colder oceans=less co2 in the Atmosphere.

Of course naturally the earth removes the co2 and there are cycles of warm and cold. The midevil warm period was in a time of high solar activity and the little ice age was within a time of low solar activity...Our current warm up makes up the highest solar activity since the mid evil warm period...So of course what do you expect. But on the other hand it maxed for output in the 1950's...In has been going down since...We maybe being lied to, but that would lead to very bad things as the people would find out their government is trying to steal all the power and rule over the people of the world. In which could lead to much pain.

Of course there is cycles, but co2 is acting different if you have any trust at all within the offical data.
 
Last edited:
I must admit I am a little skeptical of the ice core records. I can see how there could be many confounding factors involved, and much loss of peaks and valleys.

I suppose my biggest difference with AGW alarmists is over the ability of CO2 to cause a major impact on climate. A doubling of CO2 (and we're not there yet) only causes a theoretical 1C increase. And it seems to me that the cloud system is a built in thermostat that has kept the temperature of the earth awfully steady over the life of the planet. The young faint sun, active volcanic eras, continental shifts and ocean current disruptions and changes have all been smoothed out and those were a heck of a lot bigger changes to the system than a doubling or two of CO2.
 
proxies for temperature, CO2, etc need a lot of manipulation and generalizations therefor the scientists' frame of mind can have a lot of impact on what is concluded for the data. once a general mindset is in place excuses for evidence that contradicts the theory are found and put down as fact even if the excuses would seem unreasonable without the theory for context. just look at the herculean efforts to remove the Midieval Warm Period which would be totally ridiculous except that it helps the AGW cause.
I'm no science wiz but the information I read tells me the earth warms and cools in cycles. We are ending a warming cycle and now entering a cooling cycle

The Midevil warm period lasted 400 years and the roman warm period close to that if not more...We just came out of a little ice age...One of the coldest periods since the younger dyas of 8,500 years ago...I doubt we're quite ready for another cold period...At least like the one we just got out of.


The evidence of the last two winters is allready proving you wrong Matthew.
 
201011.gif


Global Highlights

* The combined global land and ocean average surface temperature for November 2010 was 0.69°C (1.24°F) above the 20th century average of 12.9°C (55.2°F). This was the second warmest such period on record. 2004 was the warmest November on record.

* The combined global land and ocean average surface temperature for fall (September–November) 2010 was the sixth warmest on record for the season, 0.58°C (1.04°F) above the 20th century average of 14.0°C (57.1°F).

* For the 2010 year-to-date (January–November), the combined global land and ocean surface temperature was 0.64°C (1.15°F) above the 20th century average—the warmest such period since records began in 1880.

* The November 2010 Northern Hemisphere land and ocean surface temperature was the warmest November on record, while the Southern Hemisphere land and ocean surface temperature was the 13th warmest November on record.

* The November 2010 global land surface temperature was the warmest on record, at 1.52°C (2.74°F) above the 20th century average, while the November global ocean temperature tied with 1987 and 2008 as the tenth warmest on record, at 0.39°C (0.70°F) above average.

* The January–November 2010 Northern Hemisphere land surface temperature was the second warmest such period on record, while the Southern Hemisphere was the fourth warmest on record.

201001-201011.gif
 
Last edited:
201011.gif


Global Highlights

* The combined global land and ocean average surface temperature for November 2010 was 0.69°C (1.24°F) above the 20th century average of 12.9°C (55.2°F). This was the second warmest such period on record. 2004 was the warmest November on record.

* The combined global land and ocean average surface temperature for fall (September–November) 2010 was the sixth warmest on record for the season, 0.58°C (1.04°F) above the 20th century average of 14.0°C (57.1°F).

* For the 2010 year-to-date (January–November), the combined global land and ocean surface temperature was 0.64°C (1.15°F) above the 20th century average—the warmest such period since records began in 1880.

* The November 2010 Northern Hemisphere land and ocean surface temperature was the warmest November on record, while the Southern Hemisphere land and ocean surface temperature was the 13th warmest November on record.

* The November 2010 global land surface temperature was the warmest on record, at 1.52°C (2.74°F) above the 20th century average, while the November global ocean temperature tied with 1987 and 2008 as the tenth warmest on record, at 0.39°C (0.70°F) above average.

* The January–November 2010 Northern Hemisphere land surface temperature was the second warmest such period on record, while the Southern Hemisphere was the fourth warmest on record.

201001-201011.gif


And what is the quality of the data?

I think the majority of it is fair to good.
 
I must admit I am a little skeptical of the ice core records. I can see how there could be many confounding factors involved, and much loss of peaks and valleys.

I suppose my biggest difference with AGW alarmists is over the ability of CO2 to cause a major impact on climate. A doubling of CO2 (and we're not there yet) only causes a theoretical 1C increase. And it seems to me that the cloud system is a built in thermostat that has kept the temperature of the earth awfully steady over the life of the planet. The young faint sun, active volcanic eras, continental shifts and ocean current disruptions and changes have all been smoothed out and those were a heck of a lot bigger changes to the system than a doubling or two of CO2.

Where is your link for an increase of 1 C for a doubling of CO2? While a few studies put that number that low, the vast majority put it about 2.5 C, and more put it far higher than put it lower than that. Here is where you can see a compilation of scientific studies on that subject and the conclusions.

Climate Sensitivity
 

Attachments

  • $earth-map.jpg
    $earth-map.jpg
    45.6 KB · Views: 127
Last edited:
That does not explain why some as you say part's of the earth was way more hotter than it is now.


proxies for temperature, CO2, etc need a lot of manipulation and generalizations therefor the scientists' frame of mind can have a lot of impact on what is concluded for the data. once a general mindset is in place excuses for evidence that contradicts the theory are found and put down as fact even if the excuses would seem unreasonable without the theory for context. just look at the herculean efforts to remove the Midieval Warm Period which would be totally ridiculous except that it helps the AGW cause.
I'm no science wiz but the information I read tells me the earth warms and cools in cycles. We are ending a warming cycle and now entering a cooling cycle


The instrument you are using to mark time is a stop watch and you need a calendar. The planet's climate moves with glacial speed. Sometimes slower.

The talk of climate change within the course of years is hogwash. Any cycle that can be observed within a lifetime is like a sunrise compared to a season. 50 thousand years, 100 thousand years, a million years. These are the little black lines on the time line of the climate.

The link below will show you a graph of the roughly 14 degree drop in global temperature for our climate over the last 65 million years to date.

Our current period is labeled as the period of rapid glaciation. From a historical point of view, we are pretty cold in relative terms. The question should not be why are we warming, but, rather, why are we so cold?

File:65 Myr Climate Change Rev.png - Global Warming Art
 
We're exactly at our average number of heating degree days in Central Virginia since July 1, meaning that in total the fall/winter's been average, but December much colder than usual. We've had 70% of our seasonal average for snow, and we're not out of December. Most east coast cities are about the same - hotter than average summer, average fall/winter in total, colder than avg December.

Some areas have had a cold year. Los Angeles had just 346 cooling degree days this year, normal is 644. This means fewer days than average have had median temps above 65. It's also had more heating degree days than average 429 vs. 363, meaning more days than average have had median temps below 65.

Personally, I like looking at NWS source data better than media reports about global temps, especially with all the hype and the IPCC's political agenda.
 
proxies for temperature, CO2, etc need a lot of manipulation and generalizations therefor the scientists' frame of mind can have a lot of impact on what is concluded for the data. once a general mindset is in place excuses for evidence that contradicts the theory are found and put down as fact even if the excuses would seem unreasonable without the theory for context. just look at the herculean efforts to remove the Midieval Warm Period which would be totally ridiculous except that it helps the AGW cause.
I'm no science wiz but the information I read tells me the earth warms and cools in cycles. We are ending a warming cycle and now entering a cooling cycle


The instrument you are using to mark time is a stop watch and you need a calendar. The planet's climate moves with glacial speed. Sometimes slower.

The talk of climate change within the course of years is hogwash. Any cycle that can be observed within a lifetime is like a sunrise compared to a season. 50 thousand years, 100 thousand years, a million years. These are the little black lines on the time line of the climate.

The link below will show you a graph of the roughly 14 degree drop in global temperature for our climate over the last 65 million years to date.

Our current period is labeled as the period of rapid glaciation. From a historical point of view, we are pretty cold in relative terms. The question should not be why are we warming, but, rather, why are we so cold?

File:65 Myr Climate Change Rev.png - Global Warming Art

Odd, that is not at all what you site says or shows. At the end of the Eocene, there was a very big drop, very rapid. And there have been many periods of rapid change before and after that, as the graph showl.

Most recently, we have evidence of very rapid climate change going into and out of the Younger Dryas.


File:65 Myr Climate Change Rev.png - Global Warming Art

Also appearing on this graph are the Eocene Climatic Optimum, an extended period of very warm temperatures, and the Paleocene-Eocene Thermal Maximum (labeled PETM). The PETM is very short lived high temperature excursion possibly associated with the destabilization of methane clathrates and the rapid buildup of greenhouse gases in the atmosphere. Due to the coarse sampling and averaging involved in this record, it is likely that the full magnitude of the PETM is underestimated by a factor of 2-4 times its apparent height

Now that is from your site. Clearly says we have evidence of a large and rapid change in planetary temperature due to the build up of GHGs.

Do you ever read before you post? Why in hell do you think that this site represents proof that only slow changes occur? It state right within the site that there have been rapid changes, some of them associated with the rapid build up of GHGs.
 
I do not think there is no major revelations. More a matter of putting things in what is perhaps a more realistic time scales and the need to act sooner rather than later.
 
I'm no science wiz but the information I read tells me the earth warms and cools in cycles. We are ending a warming cycle and now entering a cooling cycle


The instrument you are using to mark time is a stop watch and you need a calendar. The planet's climate moves with glacial speed. Sometimes slower.

The talk of climate change within the course of years is hogwash. Any cycle that can be observed within a lifetime is like a sunrise compared to a season. 50 thousand years, 100 thousand years, a million years. These are the little black lines on the time line of the climate.

The link below will show you a graph of the roughly 14 degree drop in global temperature for our climate over the last 65 million years to date.

Our current period is labeled as the period of rapid glaciation. From a historical point of view, we are pretty cold in relative terms. The question should not be why are we warming, but, rather, why are we so cold?

File:65 Myr Climate Change Rev.png - Global Warming Art

Odd, that is not at all what you site says or shows. At the end of the Eocene, there was a very big drop, very rapid. And there have been many periods of rapid change before and after that, as the graph showl.

Most recently, we have evidence of very rapid climate change going into and out of the Younger Dryas.


File:65 Myr Climate Change Rev.png - Global Warming Art

Also appearing on this graph are the Eocene Climatic Optimum, an extended period of very warm temperatures, and the Paleocene-Eocene Thermal Maximum (labeled PETM). The PETM is very short lived high temperature excursion possibly associated with the destabilization of methane clathrates and the rapid buildup of greenhouse gases in the atmosphere. Due to the coarse sampling and averaging involved in this record, it is likely that the full magnitude of the PETM is underestimated by a factor of 2-4 times its apparent height

Now that is from your site. Clearly says we have evidence of a large and rapid change in planetary temperature due to the build up of GHGs.

Do you ever read before you post? Why in hell do you think that this site represents proof that only slow changes occur? It state right within the site that there have been rapid changes, some of them associated with the rapid build up of GHGs.

It wouldn't fucking suprize me once the methane dam breaks the arctic warms 15c in a few years time. Once that occurs the entire earth warms and the rate of warming doubles or triples.
 

Forum List

Back
Top