2011 global temperature thread

That is one of the major fears. Problem is, we have no idea at what temperature the release becomes inevitable. We may have already passed that point, it may well be at a higher temperature and GHG content in the atmosphere. That is the problem with the AGW. We know little about what the results are, and in what manner they will come about.

Thus far, we know for sure that the experts predictions concerning results have been far to conservative.

Yeah...I doubt that the methane can remain capped for more then 5-10 more years tops...

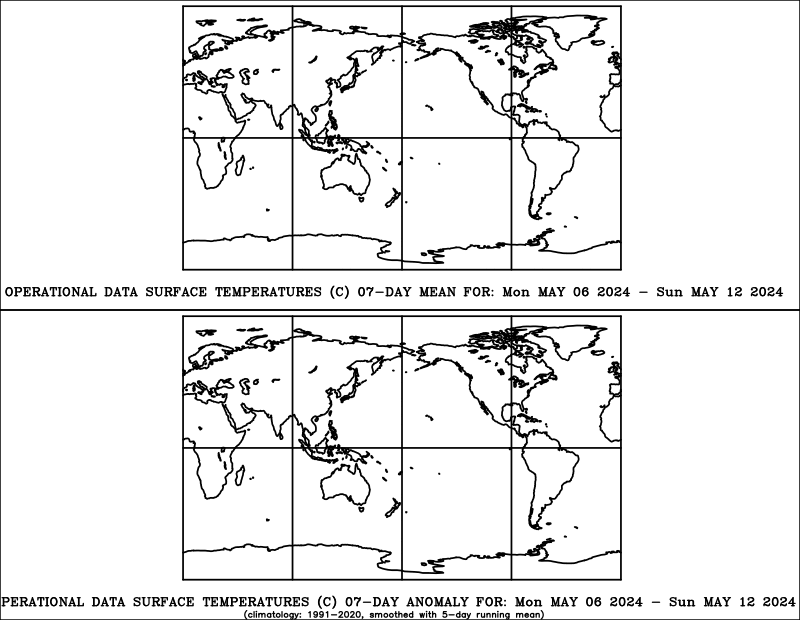
Anyways this thread is where we post temperature data from the giss, Noaa, UAH, Rss, ect...Discussion on the temperature of earth. I hope the skeptics could bring some data too? But anyways this thread is for serious discussion. So only serious debate of temperature of our earth and data in this thread. This thread is not to mess around, but facts and data.


past 7 days

sfctmpmer_07b.fnl.gif
 
Last edited:
I'm no science wiz but the information I read tells me the earth warms and cools in cycles. We are ending a warming cycle and now entering a cooling cycle


The instrument you are using to mark time is a stop watch and you need a calendar. The planet's climate moves with glacial speed. Sometimes slower.

The talk of climate change within the course of years is hogwash. Any cycle that can be observed within a lifetime is like a sunrise compared to a season. 50 thousand years, 100 thousand years, a million years. These are the little black lines on the time line of the climate.

The link below will show you a graph of the roughly 14 degree drop in global temperature for our climate over the last 65 million years to date.

Our current period is labeled as the period of rapid glaciation. From a historical point of view, we are pretty cold in relative terms. The question should not be why are we warming, but, rather, why are we so cold?

File:65 Myr Climate Change Rev.png - Global Warming Art

Odd, that is not at all what you site says or shows. At the end of the Eocene, there was a very big drop, very rapid. And there have been many periods of rapid change before and after that, as the graph showl.

Most recently, we have evidence of very rapid climate change going into and out of the Younger Dryas.


File:65 Myr Climate Change Rev.png - Global Warming Art

Also appearing on this graph are the Eocene Climatic Optimum, an extended period of very warm temperatures, and the Paleocene-Eocene Thermal Maximum (labeled PETM). The PETM is very short lived high temperature excursion possibly associated with the destabilization of methane clathrates and the rapid buildup of greenhouse gases in the atmosphere. Due to the coarse sampling and averaging involved in this record, it is likely that the full magnitude of the PETM is underestimated by a factor of 2-4 times its apparent height

Now that is from your site. Clearly says we have evidence of a large and rapid change in planetary temperature due to the build up of GHGs.

Do you ever read before you post? Why in hell do you think that this site represents proof that only slow changes occur? It state right within the site that there have been rapid changes, some of them associated with the rapid build up of GHGs.


In all but a very few instances, 2 or 3 in the 4 billion year long history of the planet, the increase or decrease of GHG's is caused by temperature variation. To claim that the GHG's Cause temperature change historically is just not supported by facts or history.

The PETM happened about 50 million years ago and then the temperature rose to the peak of the PETM gradually following that if the graph is to be believed. The little space covered by the time elapse of the PETM on the graph represents about a half million years.

Checking the graph as it comes to the more recent times, the radical moves up and down are far quicker than the PETM or any other period for the last million or so years and the part you are exhorting us to panic over is the last 150 or so years.

My contention is that the planet has cooled by about 14 degrees in the last 65 million years. Are you saying that it has not?
 
That is one of the major fears. Problem is, we have no idea at what temperature the release becomes inevitable. We may have already passed that point, it may well be at a higher temperature and GHG content in the atmosphere. That is the problem with the AGW. We know little about what the results are, and in what manner they will come about.

Thus far, we know for sure that the experts predictions concerning results have been far to conservative.


Results of what?
 
The instrument you are using to mark time is a stop watch and you need a calendar. The planet's climate moves with glacial speed. Sometimes slower.

The talk of climate change within the course of years is hogwash. Any cycle that can be observed within a lifetime is like a sunrise compared to a season. 50 thousand years, 100 thousand years, a million years. These are the little black lines on the time line of the climate.

The link below will show you a graph of the roughly 14 degree drop in global temperature for our climate over the last 65 million years to date.

Our current period is labeled as the period of rapid glaciation. From a historical point of view, we are pretty cold in relative terms. The question should not be why are we warming, but, rather, why are we so cold?

File:65 Myr Climate Change Rev.png - Global Warming Art

Odd, that is not at all what you site says or shows. At the end of the Eocene, there was a very big drop, very rapid. And there have been many periods of rapid change before and after that, as the graph showl.

Most recently, we have evidence of very rapid climate change going into and out of the Younger Dryas.


File:65 Myr Climate Change Rev.png - Global Warming Art

Also appearing on this graph are the Eocene Climatic Optimum, an extended period of very warm temperatures, and the Paleocene-Eocene Thermal Maximum (labeled PETM). The PETM is very short lived high temperature excursion possibly associated with the destabilization of methane clathrates and the rapid buildup of greenhouse gases in the atmosphere. Due to the coarse sampling and averaging involved in this record, it is likely that the full magnitude of the PETM is underestimated by a factor of 2-4 times its apparent height

Now that is from your site. Clearly says we have evidence of a large and rapid change in planetary temperature due to the build up of GHGs.

Do you ever read before you post? Why in hell do you think that this site represents proof that only slow changes occur? It state right within the site that there have been rapid changes, some of them associated with the rapid build up of GHGs.


In all but a very few instances, 2 or 3 in the 4 billion year long history of the planet, the increase or decrease of GHG's is caused by temperature variation. To claim that the GHG's Cause temperature change historically is just not supported by facts or history.

By whose facts or history? The scientists, paleoclimatologists, that investigate this sort of thing, totally disagree with you, as do most of the physicists in the world.

The PETM happened about 50 million years ago and then the temperature rose to the peak of the PETM gradually following that if the graph is to be believed. The little space covered by the time elapse of the PETM on the graph represents about a half million years.


Checking the graph as it comes to the more recent times, the radical moves up and down are far quicker than the PETM or any other period for the last million or so years and the part you are exhorting us to panic over is the last 150 or so years.

My contention is that the planet has cooled by about 14 degrees in the last 65 million years. Are you saying that it has not?

Red herrings and strawmen are your specialty, Code.

Real science from real scientists

http://www.agu.org/journals/ABS/2007/2007GC001784.shtml

On the duration of the Paleocene-Eocene thermal maximum (PETM)

On the duration of the Paleocene-Eocene thermal maximum (PETM)
Ursula Röhl

Center for Marine Environmental Sciences (MARUM), Bremen University, Leobener Strasse, D-28359 Bremen, Germany

Thomas Westerhold

Center for Marine Environmental Sciences (MARUM), Bremen University, Leobener Strasse, D-28359 Bremen, Germany

Timothy J. Bralower

Department of Geosciences, Pennsylvania State University, University Park, Pennsylvania 16802, USA

James C. Zachos

Earth and Planetary Sciences Department, University of California, Santa Cruz, California 95064, USA

The Paleocene-Eocene thermal maximum (PETM) is one of the best known examples of a transient climate perturbation, associated with a brief, but intense, interval of global warming and a massive perturbation of the global carbon cycle from injection of isotopically light carbon into the ocean-atmosphere system. One key to quantifying the mass of carbon released, identifying the source(s), and understanding the ultimate fate of this carbon is to develop high-resolution age models. Two independent strategies have been employed, cycle stratigraphy and analysis of extraterrestrial helium (HeET), both of which were first tested on Ocean Drilling Program (ODP) Site 690. These two methods are in agreement for the onset of the PETM and initial recovery, or the clay layer (“main body”), but seem to differ in the final recovery phase of the event above the clay layer, where the carbonate contents rise and carbon isotope values return toward background values. Here we present a state-of-the-art age model for the PETM derived from a new orbital chronology developed with cycle stratigraphic records from sites drilled during ODP Leg 208 (Walvis Ridge, Southeastern Atlantic) integrated with published records from Site 690 (Weddell Sea, Southern Ocean, ODP Leg 113). During Leg 208, five Paleocene-Eocene (P-E) boundary sections (Sites 1262 to 1267) were recovered in multiple holes over a depth transect of more than 2200 m at the Walvis Ridge, yielding the first stratigraphically complete P-E deep-sea sequence with moderate to relatively high sedimentation rates (1 to 3 cm/ka, where “a” is years). A detailed chronology was developed with nondestructive X-ray fluorescence (XRF) core scanning records on the scale of precession cycles, with a total duration of the PETM now estimated to be ∼170 ka. The revised cycle stratigraphic record confirms original estimates for the duration of the onset and initial recovery but suggests a new duration for the final recovery that is intermediate to the previous estimates by cycle stratigraphy and HeET.
 
Last edited:
Earth's five mass extinction events

What Veron 2008 found was each mass extinction event corresponded to periods of quickly changing atmospheric CO2. When CO2 changes slowly, the gradual increase allows mixing and buffering of surface layers by deep ocean sinks. Marine organisms also have time to adapt to the new environmental conditions. However, when CO2 increases abruptly, the acidification effects are intensified in shallow waters owing to a lack of mixing. It also gives marine life little time to adapt.


And not one of them from heat. The only climatic possibility (with any science to back it up) for an extinction is cold.
 
Back on topic of the thread what do you think December rank is going to be? In what is 2010 going to rank...I don't care if you think it is a fraud or not, but what would be your guess for each giss, noaa, uah, rss.
 
Last edited:
Earth's five mass extinction events

What Veron 2008 found was each mass extinction event corresponded to periods of quickly changing atmospheric CO2. When CO2 changes slowly, the gradual increase allows mixing and buffering of surface layers by deep ocean sinks. Marine organisms also have time to adapt to the new environmental conditions. However, when CO2 increases abruptly, the acidification effects are intensified in shallow waters owing to a lack of mixing. It also gives marine life little time to adapt.


And not one of them from heat. The only climatic possibility (with any science to back it up) for an extinction is cold.

Lordy, lordy, faux geologist, you are one dumb fuck. PT Extinction.
 
December. Hard to tell at this point. Some exceptionally cold areas, some esceptionally warm areas. I would go with around 5th.

The more I study the temperatures the more I come to the concussion that the nina has kicked in big time this month and the below avg areas where huge this month. I'm going to say this for dec...

giss 5th
Noaa 9th
uah 12th
rss 14th

This should make 2010
giss 1st
Noaa 2nd
uah 3rd
Rss 3-4th
 
Yes, I would definately go with 2010 being in the top 3. However, the other results, the precip events, exceptional weather, have been greater this year than any I remember. Wonder how long we will have to wait for an article reviewing this years weather from that perspective to appear in a peer reviewed journal?
 
The nina started in May and reached -1.8 in Oct. It is around -1.7c in area 3.4 today...Most respectable nina in about 40 years. In were discussing top 3 years with it? Wow...I thought about this hard and believe that if we had a moderate year, no nino needed...We woud be number one by .02c+. I thought about a few other things and come to the idea that were .15c to .17c warmer then 1998 right now. 2005 even had a weak nino conditions in 3.4 for awhile(.2 to .4c in 3.4). Which got us into the nino of 2006.

2007, 2008 and early part of 2009 had some Nina or weak effects of one. I do believe that the warming has decreased sighty, but maybe because of other factors as the sun spot minimum that we are in.

I believe that around 2012 any nina weaker then the 1954 event could give a number one year over 1998 and 2005.
 
Last edited:
Rss data for Dec

Temperature Variation From Average:
Lower Troposphere:
Global:
December 2010: +0.25 °C
Northern Hemisphere: +0.24 °C
Southern Hemisphere: +0.26 °C

Peak recorded anomaly:
April, 1998: +0.86 °C
Current relative to peak recorded: -0.61 °C

Last update: January 3, 2011


RSS MSU 12-2010: +0.25 °C. Rank: 7/32
Warmest December in this series was in 2003.
Average last 12 months: 0.51 °C.

A good amount better then the 14th I predicted above.
 
Last edited:
Earth's five mass extinction events

What Veron 2008 found was each mass extinction event corresponded to periods of quickly changing atmospheric CO2. When CO2 changes slowly, the gradual increase allows mixing and buffering of surface layers by deep ocean sinks. Marine organisms also have time to adapt to the new environmental conditions. However, when CO2 increases abruptly, the acidification effects are intensified in shallow waters owing to a lack of mixing. It also gives marine life little time to adapt.


And not one of them from heat. The only climatic possibility (with any science to back it up) for an extinction is cold.

Lordy, lordy, faux geologist, you are one dumb fuck. PT Extinction.


Yeah sure nimrod. There are 6 accepted theories for the PT extinction. One of them is climate change. Here is one of the better presentations (you'll notice they present evidence for both sides..something you clowns are incapable of) you will also notice that the preponderance of evidence is for cooling as the proximal cause not heat. And that is if that is the actual cause.

"Getting HOTTER
During the Permian the continents were in one landmass called Pangea. As all the land was together and was so large, it created a hot dry interia because a majority of the land was away from the sea so it experienced little rainfall. It also had great seasonal fluctuations due to the lack of the modeerating affects of a large water body.
The climates temperature may have risen due to the increase in volcanic activity. During the end of the Permian the Siberian traps were erupting, releasing vast amounts of different gasses into the atmosphere. One of these gasses was Carbondioxide (CO2). This has an insulating affect on the atmosphere making the climate temperature warmer.

Increased climate temperature has also been shown to slow the metabolism of creatures, and upset the formation of internal and external carbonate (CaCO3) skeletons. Many marine organisms have carbonate skeletons. If these creatures were unabale to form their skeletons they would have either no support for their bodies or no external protection, so would be unable to survive. (A. H. Knoll)

A hotter climate of the low latitudes during the Permian lead to a reduction in the area of coal swamps. As this habitat decreased, species that lived there such as amphibians and some spore bearing plants became extinct.


--------------------------------------------------------------------------------


Getting COLDER


As well as getting hotter there is evidence that the climate also cooled. Sedimentological evidence for cooling comes from glacial deposits in polar zones, and thick dune sands and evaporites from temperate zones that represent a cool dry environment.
Some of the volcanic gasses released from the Siberian trap flood basalts could have the opposite affect to the CO2, cooling the climate insted of heating it. Why these had this affect is mentioned in volcanism

Other evidence comes form the reduced presence of carbonate limestones around the end of the Permian. This process would have had the greatest affect in the tropics where most of the Earth's limestone production occurs. Cooling would eliminate the tropical ares and kill tropical species, and if there were less Carbonate produceres there would be less Carbonate which is what is seen.

Another cooling affect comes from glaciation. Cooling can happen in low latitudes without there being glaciation and in this way just the cooling of the climate would be the cause of extinction by the method mentioned above."

Palaeobiology and Biodiversity Research Group, Department of Earth Sciences, University of Bristol
 
If it gets too hot ? I'll add shade.
If it gets too cold ? Plastic.
If it rains too much ? More plastic.
If it doesn't rain enough ? Another solar powered pump, or 10, for my drip systems.
 
There is a very good paper out concerning trapp events of this period, the the coal beds they covered and intruded, and how it became an intense methane forming event. If I can find it, I will post it. And it definately was very hot during the event, and the O2 level in the atmosphere dropped to about 11%.

Permian-Triassic extinction event - Paleontology Wiki

Duration of eventEditAt one time, this die-off was assumed to have been a gradual reduction over several million years. Now, however, it is commonly accepted that the event lasted less than a million years, from 252.3 to 251.4 Ma (both numbers ±300,000 years), a very brief period of time in geological terms. A detailed study of plutonium-to-lead decay in zircons in ash beds in China dates the extinction 252.6 ± 0.2 million years ago, synchronous with the Siberian flood volcanism (Mundil 2004).

Organisms throughout the world, regardless of habitat, suffered similar rates of extinction over the same relatively short period, showing that the extinction was global and sudden, not gradual or localized.

New evidence from strata in Greenland shows evidence of a double extinction, with a separate, less dramatic extinction occurring 9 Ma before the Permian-Triassic (P-T) boundary, at the end of the Guadalupian epoch. Confusion of these two events is likely to have influenced the early view that the extinction was extended
 
Permian extinction - Palaeos.org

Not one but two Permian Extinction Events
Originally there was thought to be only a single end Permian mass extinction. More accurate stratigraphic resolution reveal two huge mass extinction events, one at the end of the Guadalupian epoch and the other at the end of the Permian (and because taxonomic losses were divided between the two crises and the intervening interval, the terminal extinction eliminated only about 80 percent of marine species, not 95 or 96 percent as previously estimated) (Stanley & Yang 1994, although this thesis is not without its critics, e.g. Clapham et al 2009). Gregory Retallack (a specialist in fossil soils) and co-workers have associated these mass extinctions with catastrophic greenhouse events and hyperanoxia. Retallack 2005 Retallack et al 2006. They use new paleobotanical, paleopedological, and carbon isotopic studies of Portal Mountain, Antarctica, and comparable studies in the Karoo Basin, South Africa to shown that there were two separate abrupt mass extinctions on land, which can also be linked to corresponding marine invertebrate extinctions. One was the end Guadalupian (end Capitanian), the other the better known end Permian extinction. Both were times of short-lived warm and wet greenhouse climate, marked soil erosion, transition from high- to low-sinuosity and braided streams, and wetland soil stagnation. Retallack et al 2006 (abstract)

This research with carbon isotopes also hints at a further, earler mass-extinction at the end of the Cisuralian. If so, these extinction events would explain the three radically different dynasties of terrestial life during the Permian - the pelycosaur, dinocephalian, and advanced therapsid.

In order to explain how the necessary amounts (a hundred to a thousand gigatons) of methane could be released into the atmosphere within a period of 10 to 100 thousand years, Retallack et al 2006 p.1409 suggest catastrophic methane outbursts to the atmosphere from from volcanic intrusion (feeder dikes and flood basalts) into massive coal deposits. They mention that both the end-Guadalupian Emeishan Basalt (Zhou et al., 2002) and end-Permian Siberian Traps (Kamo et al., 2003) (see illustration above) erupted through pre-existing coal measures.

Another (perhaps complementary) cause, suggested by Isozaki 2009 was mantle superplume activity, which also led to the Illawarra Magnetic Reversal

For much of the Triassic, oxygen levels remained low, and according to Ward 2006, this favoured dinosaurs which - like birds would have had a more efficient aerobic metabolism, over mammals. Early Triassic survivors of the mass extinction like Lystrosaurus and Proterosuchus had stocky bodies and barrel-chests indicating increased lung capacity, while therapsid carnivores like Galesaurus and Thrinaxodon had reduced lumbar ribs which, along with thickened thoracic ribs and higher thoracic vertebral spines may well indicate enlarged lungs and a muscular, mammal-like diaphragm, allowing more efficient respiration. Retallack et al 2003 p.1148
 
I don't doubt that the pendulum of temperature swings with or without mankind.

The question, the real question is this:

Is mankind's activity exascerbating that swing?

It might be if you believe that the global temperatures that are being reported are honest.

Of course if you think that data is not valid, then of course, you're going to be dubious that global warming is happening.

There isn't a person here, far as I can tell, truly qualified to weight in on whether the reports we're getting are correct.
 

Forum List

Back
Top