ReinyDays
Platinum Member
When a person discusses climate, but all they talk about is temperature, beware that they are fools.
... or just plain deceived ... what do we say about folks who scale their barometers in ... you know ...
feet ...Follow along with the video below to see how to install our site as a web app on your home screen.
Note: This feature may not be available in some browsers.
When a person discusses climate, but all they talk about is temperature, beware that they are fools.
feet ...That was my 25th wedding anniversary. I don't get too many of those. My sister lived in Chartre. We stayed with her and rented a car, though most of our travel, particularly in Paris, was via subway and train. You'd have to be nuts to try to use a car in Paris. I haven't been back. But I'm pretty sure the plane would have flown without me.Crick is a member of the climate change cult who is so proud of flying to Paris that he features a picture of himself at the Louvre. His trip required enormous amounts of crude oil for airplanes and taxis but now he proselytizes against the world's most crucial and important source of energy for our very existence. View attachment 970454
The greening stopped in the 1990's. More CO2 isn't helping at all. It's making things worse.
Your propaganda is very badly outdated. That's deliberate on the part of your masters, who rely on keeping you ignorant.
View attachment 971609
Here is how the complicit left-leaning media lies to everyone.
View attachment 971611
It was much hotte in 1988 on the right, but Leftist media calls current cooler temperatures "unprecedented climate change fueled heat dome." Here's a Lefty now on his phone:
View attachment 971612
_______________________________
Plants don't need tons of it per plant. Correction: Doesn't harm, but yes is microscopic.So this microscopic gas that you say basically doesn't exist is somehow greening the planet. Sure.
Ah, the belligerent stupidity of a Dunning-Kruger afflictee, someone not smart enough to understand they're not smart. You really should stick to your SafeSpace website, where nobody is allowed to laugh at pseudoscience, and where you're a big fish in a little pond.Gawad you are stupid
Ah, the belligerent stupidity of a Dunning-Kruger afflictee, someone not smart enough to understand they're not smart. You really should stick to your SafeSpace website, where nobody is allowed to laugh at pseudoscience, and where you're a big fish in a little pond.
Now, concerning what has you failing so hard at simple math, here's more about it.
The Earth's Vegetation Stopped Expanding 20 Years Ago
Until the late 1990s, the amount of vegetation worldwide was increasing. But then it stopped, and a new study links this troubling trend to climate change.www.planetizen.com
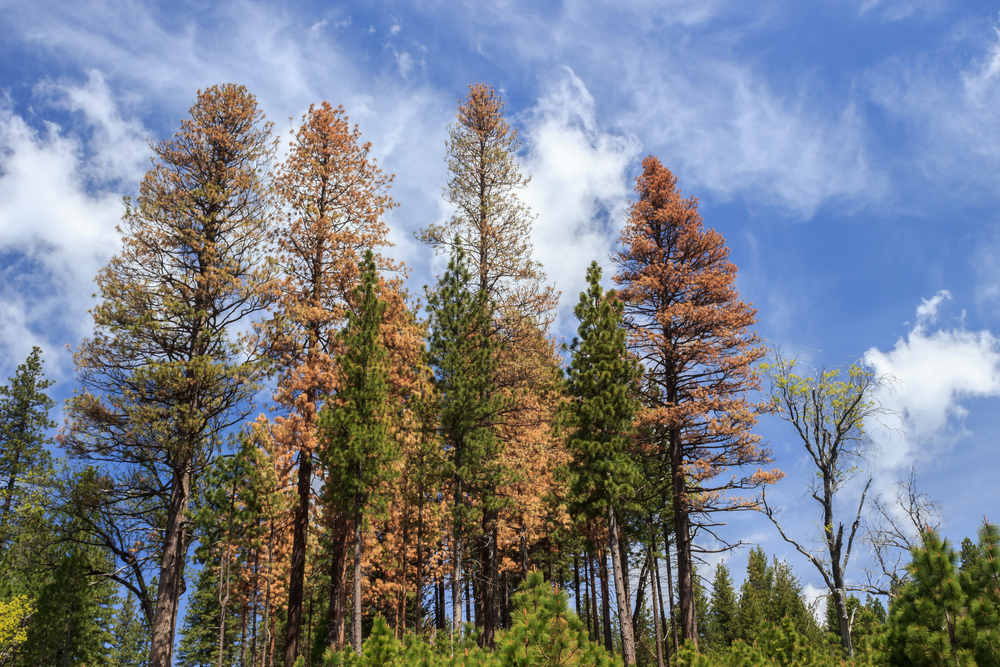
CO2 was just one bottleneck to plant growth. Remove it, and other bottlenecks then limit plant growth. And they can be even more restrictive. More heat means drier soil, more insect pests, more diseases.

 earthobservatory.nasa.gov
Ah, the belligerent stupidity of a Dunning-Kruger afflictee, someone not smart enough to understand they're not smart. You really should stick to your SafeSpace website, where nobody is allowed to laugh at pseudoscience, and where you're a big fish in a little pond.
Now, concerning what has you failing so hard at simple math, here's more about it.
The Earth's Vegetation Stopped Expanding 20 Years Ago
Until the late 1990s, the amount of vegetation worldwide was increasing. But then it stopped, and a new study links this troubling trend to climate change.
CO2 was just one bottleneck to plant growth. Remove it, and other bottlenecks then limit plant growth. And they can be even more restrictive. More heat means drier soil, more insect pests, more diseases.
Atmospheric vapor pressure deficit (VPD) is a critical variable in determining plant photosynthesis.
Have you ever heard that a pair of cats are smart?BWAHAHAHAHAHAHAHA!!!
It is manifestly clear you didn't read the paper which composed of mostly models... and you didn't address the NASA paper at all thus remains unchallenged.
This is made up misleading narrative since there is no actual evidence of greening slowdown as NASA made clear in their report which you continue to ignore as they show a greening process continuing up to 2016 while YOU and that Modeling construct paper says it stopped in the late 1990's.
The paper shares the same bogus effort as the Fraud Sherwood paper pretending, he found the hot spot.
NASA showed that the expansion was still continuing in 2016 while you and that dumb paper claims it stopped in the he he .... ha ha. 1990's
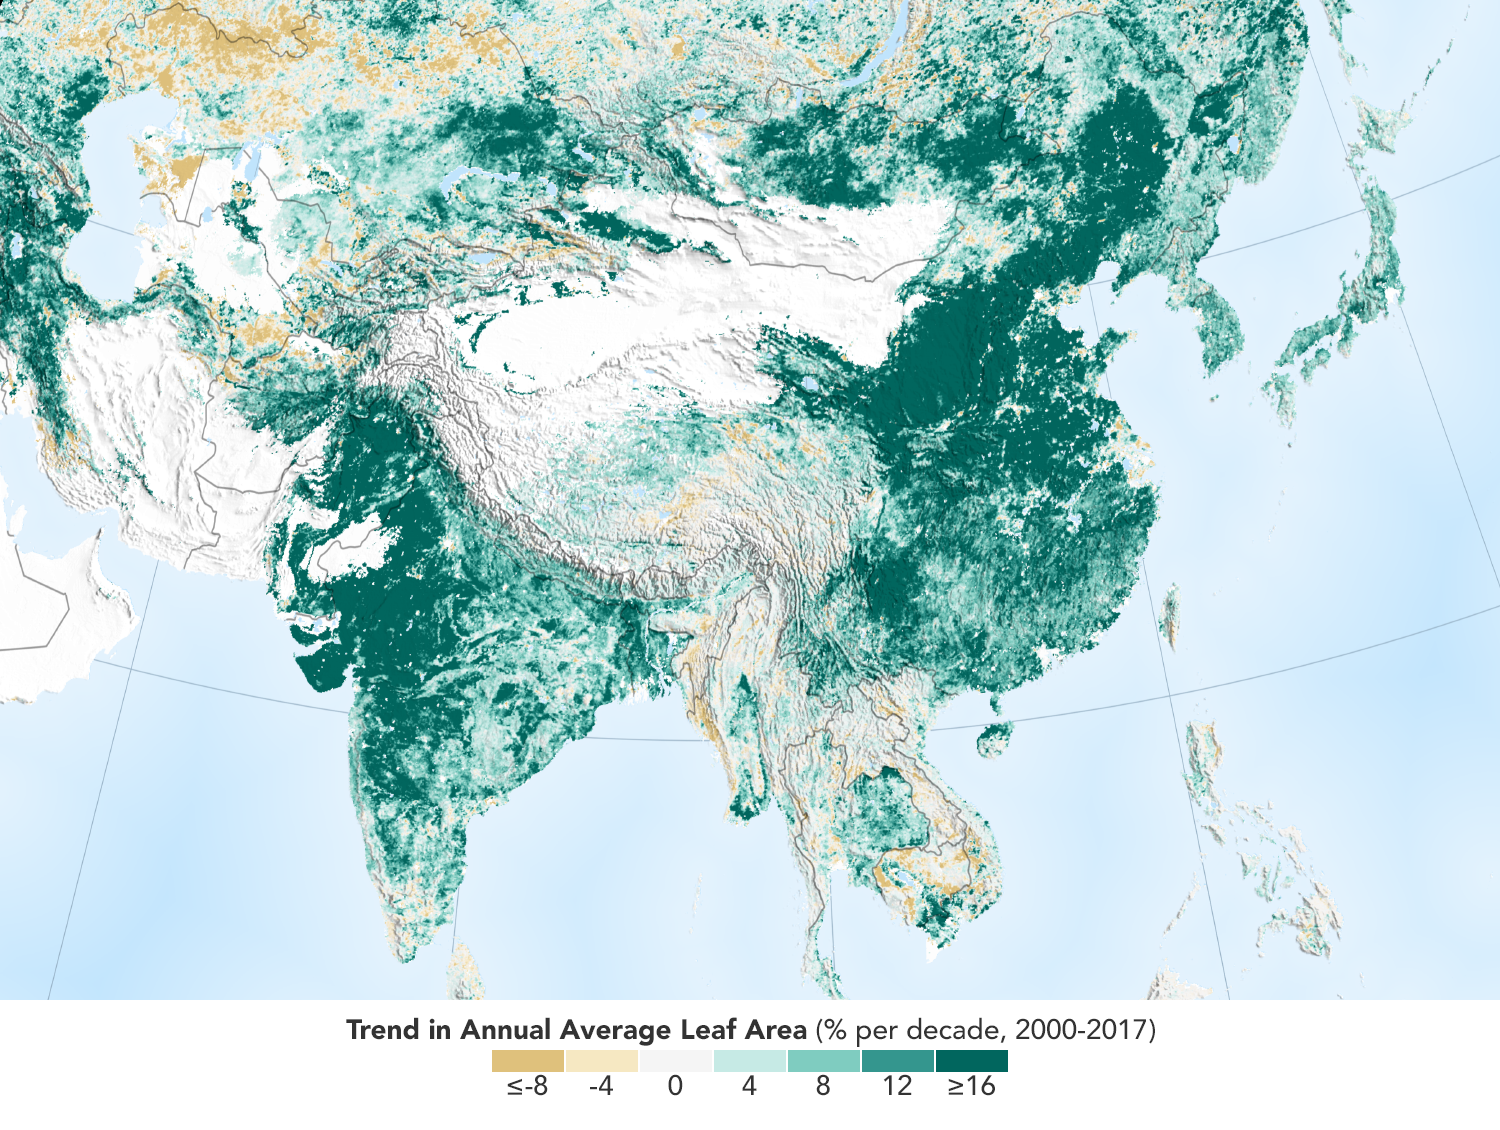
2000 - 2018Global Green Up Slows Warming - NASA Science
Scientists say the world would be even warmer if not for a surge in plant growth.
Scientists previously established that the world is greener than it was in the early 1980s. Updated maps show that the trend has continued, and researchers say reduced global warming is among the consequences.
The map above shows where greenness increased (green) and decreased (brown) across the planet between 2000 and 2018. Specifically, it shows the trend in the “leaf area index”—the amount of leaf area relative to ground area—during the growing season. The index is computed using data from the Moderate Resolution Imaging Spectroradiometer (MODIS) on NASA’s Terra and Aqua satellites. White areas are where the land is barren, built upon, or covered with ice, wetlands, or water.
Note that the map does not show overall greenness, which is why it does not exactly match heavily forested areas like the Amazon or the Congo Basin. Instead, the map shows how greenness has changed —a phenomenon most obvious in places like China and India where agriculture has intensified and governments have made efforts to conserve and expand forests.
There is a clear greening trend in boreal and Arctic regions, a result of rising temperatures.
I'm not even talking to you, and you're still weeping these anguished tears of loser-butthurt.Have you ever heard that a pair of cats are smart?
No, that's the opposite of what it says.It goes on to state that the greening process will continue for many decades into the future shown from your link:
BWAHAHAHAHAHAHAHA!!!
It is manifestly clear you didn't read the paper which composed of mostly models... and you didn't address the NASA paper
 www.nasa.gov
Yay, FACTS in fact do not harm humans, FACTS will calm Humans. Let the alarmists spin this.The following are based on Satellite DATA.
Piling it on from Nature
Vegetation greenness in 2023
Global greening continued into 2023, reaching near-record values that were dominated by regional enhancement in the mid-western USA, Europe, northern Australia and parts of equatorial Africa. In contrast, climatic events contributed to browning signals in Russia, Canada, Mexico and tropical drylands.
LINK
From Elsevier
The global greening continues despite increased drought stress since 2000
Highlights
- •
The global greening is an indisputable fact.- •
The rate of global greening increased slightly.- •
The drought has only slowed the global greening, but not caused the global browning.
LINK
From Nature,
Global climate-change trends detected in indicators of ocean ecology
LINK
There is plenty more out there and the Grains crop yields and total amount are still increasing.
I mentioned cats. Are you a cat?I'm not even talking to you, and you're still weeping these anguished tears of loser-butthurt.
Nobody forces you to pout-stalk me. You just get off on being butthurt.
The colors are there. Bright red. And it lies. Cooler is not red.The 2017 picture used no colors at all. Do you by chance have the soundtracks?
The picture with the red was 2024. The 2017 picture was simply topographic green. It used no added colors at all. There is nothing unusual about using the spectrum to indicate relative temperatures. Is using blue for cooler temps alarmist? How about green for rain? Is that too scary? Deep blue for freezing temps? How about those pointy little arrows for wind? Isn't that actually threatening?The colors are there. Bright red. And it lies. Cooler is not red.