Well, this research sure blow up AGW thoery!!!

No. Even if the sun did go into a Maunder Minimum, that's just a five-year delay in warming.That is, 5 years of our GHG emissions are a positive forcing that would be equal to the negative forcing of a dimmer sun. So no, no ice age. At worst/best, a small slowdown in warming. And that's if the prediction is correct, which is doubtful.

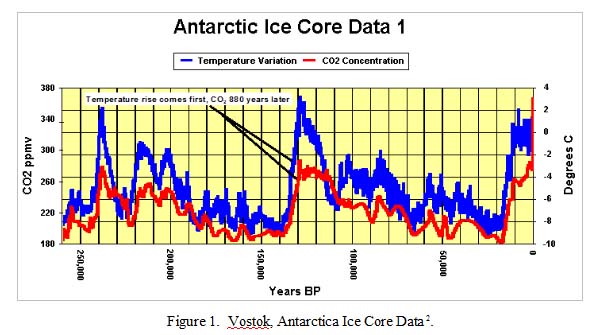
What's a positive forcing? How would it a appear in a chart comparing CO2 and temperature over say 250,000 years? Can you point to an example of this imaginary "Forcing"?

vostok-ice-data.jpg


Can you point to the "Forcing"?

The IPCC indicates a positive forcing as the secondary reaction to retained heat. IE; CO2 retains x amount of heat in our atmosphere and this causes water vapor to increase trapping more heat in the atmosphere.

There is one minor flaw to their theroy, its called the convection cycle which uses water to cool the earth. The same process they say will trap more heat and end up resulting in runaway temperatures will not allow the heat to build up and acts as a negative forcing which CO2 is powerless to stop. that increased water vapor just goes a little higher in the atmosphere and releases the heat to space, all without breaking a sweat.

To date we have not seen an increase in atmospheric water vapor or warming, but we have seen cooling and major ice growth.


Yup. Increased evaporation can lead to two different scenarios. The trophospheric hotspot, or the Iris Effect. We can't find the hotspot so the Iris Effect of more, or differently timed clouds that shade the surface and bounce the sunlight back into space, is more likely.
 
Siberia bakes with new record temperatures - and busy beaches

Our pictures show sun-seekers in Novosibirsk cooling off in the River Ob, and also at the 'Ob Sea', a huge artificial reservoir close to Siberia's biggest city.

The same scenes have been repeated over many time zones as summer came to the this vast Russian region.

'If it doesn't cool soon, I'll die,' said one beach-lover.

Weather experts said that Siberia, along with some other Russian regions, was between 4C and 6c hotter than usual in June. Such trends have been common in recent years, coupled with warmer winters in some regions, leading to claims of climate change.

Omsk beat its previous hottest temperatures, hitting 36C, while records were also set at seven meteorological stations in Novosibirsk region.

In Vengeovo, there was a temperature of 35.8 C degrees, compared with the previous high of 32.6 C. In Chistozersky district thermometers reached 37 C degrees, another record. In the city of Novosibirsk the air temperature was 31.5 C, and despite the beach scenes, it was not a record.

Russian HydroMeteoCentre reports that the first half of 2015 was abnormally hot in Russia and the record of average air temperature was beaten.

Guess your renewed little ice age better happen in a hurry.

So, again, the AGWCult is reduced to trolling the Weather channel for "Record heat" stories and blaming it on CO2

Date Location Variable Type Record Prev Record
01-25-2014 Van Buren 2, ME Low Minimum Temp All-Time Record -52 °F -49 °F (01-03-2014)
01-16-2014 Panguitch, UT Low Minimum Temp All-Time Record -52 °F -38 °F (01-09-1937)
01-07-2014 Rosebud, MO Low Minimum Temp All-Time Record -26 °F -23 °F (12-23-1989)
01-07-2014 Hot Springs, NC Low Minimum Temp All-Time Record -1 °F 0 °F (02-09-1995)
04-08-2013 Lodi, CA Low Minimum Temp All-Time Record -30 °F 11 °F (01-11-1949)
03-15-2013 Winchester 7 SE, VA Low Minimum Temp All-Time Record -20 °F -18 °F (01-19-1994)
03-14-2013 Beaumont City, TX Low Minimum Temp All-Time Record 0 °F 0 °F (03-13-2013)
03-11-2013 Elizabeth City Faa AP, NC Low Minimum Temp All-Time Record 1 °F 6 °F (01-13-1981)
03-06-2013 Hilo International AP, HI Low Minimum Temp All-Time Record 48 °F 53 °F (02-21-1962)
02-13-2013 Reserve, LA Low Minimum Temp All-Time Record -9 °F 9 °F (12-24-1989)
02-13-2013 Albany Caa AP, GA Low Minimum Temp All-Time Record 0 °F 7 °F (12-13-1962)
02-13-2013 Dothan Regional AP, AL Low Minimum Temp All-Time Record 0 °F 4 °F (01-21-1985)
02-13-2013 Burbank Vly Pump Plt, CA Low Minimum Temp All-Time Record 11 °F 22 °F (03-07-1980)
01-15-2013 Anvil Rch, AZ Low Minimum Temp All-Time Record 8 °F 8 °F (12-28-1954)
01-14-2013 Livingston 2 NNE, TX Low Minimum Temp All-Time Record 0 °F 0 °F (01-11-2013)
01-14-2013 Fountain Hills, AZ Low Minimum Temp All-Time Record 23 °F 23 °F (01-18-1987)
01-13-2013 Lund, NV Low Minimum Temp All-Time Record -18 °F -18 °F (01-12-2013)
10-12-2012 Molokai AP 524, HI Low Minimum Temp All-Time Record 1 °F 22 °F (09-26-2006)
10-02-2012 Wheeler, HI Low Minimum Temp All-Time Record 32 °F 32 °F (10-01-2012)
10-02-2012 Kahuku 912, HI Low Minimum Temp All-Time Record 32 °F 32 °F (10-01-2012)
09-18-2012 Marquette WSO AP, MI Low Minimum Temp All-Time Record 45 °F 52 °F (09-18-1980)
09-18-2012 Houghton Faa AP, MI Low Minimum Temp All-Time Record 49 °F 50 °F (09-18-1993)
09-18-2012 Ontonagon 6 SE, MI Low Minimum Temp All-Time Record 50 °F 52 °F (09-18-1991)
09-18-2012 Bandon 2 NNE, OR Low Minimum Temp All-Time Record 52 °F 55 °F (09-18-1960)
09-18-2012 Couderay 7 W, WI Low Minimum Temp All-Time Record 54 °F 58 °F (09-18-1996)
 
The current EL Moki in the northern hemisphere is a great example of increased water vapor cooling the planet. Only some minor areas near the sea and up slope are warmer. The Continent in general is BELOW AVERAGE in temperatures. Canada is cooler, the Great Plains and Mid West are much cooler, etc, etc... Very interesting indeed.
Canada is cooler? This is for June;

The opposite is true for cities from Ontario east to Atlantic Canada where temperature were 1ºC to 3ºC below normal. That didn’t mean that June was “cold” for many places but we were missing a lot of those hot, muggy days that we were used to in years past. Below is an image showing the temperature anomalies (how above or below normal the temperatures were) in North America for the month of June. What is evident is the very persistent ridge in the west bringing the hot, dry weather and the trough in the east bringing the cooler, unsettled weather.


dayna1_zpsucipm9hj.jpg


News - Summer of extremes See who s had it best and worst so far - The Weather Network

Looks to me like most of Canada was above normal, with BC way above normal, and the southeast of Canada below. Once again, you flapyap without doing the research, Billy Bob.
 
Mr. Billy Bob, what planet are you living on? This is the records for the lower 48, looks like a lot more hot than cold.

June 2015 Smashes Heat Rainfall Records Across the U.S. Weather Underground

Hot

  • Boise, Idaho: Record hottest June; previous record was in 1918.
  • Burns, Oregon: Record hottest June; previous record was in 1961.
  • Charlotte, North Carolina: Record number of June 100-degree-plus days (6); previous record (3 days) was in 1959 and 1952.
  • Ely, Nevada: Record hottest June; previous record was in 1900
  • Eugene, Oregon: Record hottest June; previous record was in 1926.
  • Helena, Montana: Record hottest June; previous record was in 1961.
  • Kalispell, Montana: Record hottest June; previous record was in 1898.
  • Las Vegas: Record hottest June; previous record was in 2013.
  • Lewiston, Idaho: Record hottest June; previous record was in 1940.
  • Medford, Oregon: Record hottest June; previous record was in 1926.
  • Miami: Record hottest year-to-date (January-June), according to the Southeast Regional Climate Center; previous hottest January-July was 2008.
  • Missoula, Montana: Record hottest June; previous record was in 1903.
  • Moses Lake, Washington: Record hottest June; previous record was in 1958.
  • Olympia, Washington: Record hottest June; previous record was in 1969.
  • Orlando Utilities Commission: All-time peak power use record on June 22.
  • Pendleton, Oregon: Record hottest June; previous record was in 1961.
  • Portland, Oregon: Record hottest June; previous record was in 1992.
  • Provo, Utah: Record hottest June; previous record was in 1994.
  • Raleigh, North Carolina: Record streak of 95-degree-plus highs (12 straight days) from June 13-24; previous record (9 straight days) was from July 13-21, 1977.
  • Reno, Nevada: Record hottest June; previous record was in 2006.
  • Salem, Oregon: Record hottest June; previous record was in 1926.
  • Salt Lake City: Record hottest June; previous record was in 1988.
  • Seattle: Record hottest June; previous record was in 1992; also the record warmest January-June.
  • Spokane, Washington: Record hottest June; previous record was in 1922.
  • The Dalles, Oregon: Record hottest June; previous record was in 1977.
  • Walla Walla, Washington: Record hottest June; previous record was in 1992.
  • Wenatchee, Washington: Record hottest June; previous record was in 1992.
  • Winnemucca, Nevada: Record hottest June; previous record was in 1918.
  • Yakima, Washington: Record hottest June; previous record was in 1948.
(MORE: All June Calendar-Day, All-time Northwest Heat Records | Spain's Record Heat)

Dry
  • Great Falls, Montana: Record driest June (0.44 inches); previous record was 0.52 inches in 1960.
  • Portland, Oregon: Longest June dry streak: 24 days without measurable rainfall June 4-27.
  • Quillayute, Washington: Record driest June (0.20 inches); previous record was 0.40 inches in 1967.
  • San Francisco (downtown): Record driest year-to-date (3.10 inches); previous record was 3.51 inches in 2013; average January-June precipitation is 14.54 inches.
(MORE: Alaska's June Wildfires)

Cold
  • Boston: Record cold daily high for June – 49 degrees – set two days in a row on June 1 and 2. This was 6 degrees colder than the daily average low, and is an average high for March 29 or Nov. 22.
  • Bangor, Maine: Record cold first half of a year; also it was the fifth coldest June, coldest since 1977.
Contributing: Weather Underground's Christopher Burt, senior digital meteorologist Nick Wiltgen, meteorologist Brandon Wright and many other behind-the-scenes meteorologists at The Weather Channel.
 
We can't find the hotspot

Conspiracy claptrap.

so the Iris Effect of more, or differently timed clouds that shade the surface and bounce the sunlight back into space, is more likely.

Lindzen's Iris effect was debunked a decade ago. There's zero evidence to support it, and all kinds against it.

And that won't matter a bit to the True Believers.
 
Warmest true believer Bjorn Stevens had two papers published this year. The first one on aerosols crippled the claim for high climate sensitivity, effectively cutting it in half.

The second put the trophospheric hotspot on the rocks and reintroduced the Iris Effect from the warmist camp.

Trenberth was certainly pissed.


.
The paper is poorly written and misleading. It wasn’t necessary to blow the iris horn.”
Trenberth seemed almost infuriated:

The authors even wrote it in the damn title.”

At least this time the editor of the journal wasn't forced to resign in shame.

The science is settled Ian.. The last revision of Climate Science textbooks went out in 2008..
You're just a hopeless last warrior for the denial side.. :boohoo::itsok:
 
The current EL Moki in the northern hemisphere is a great example of increased water vapor cooling the planet. Only some minor areas near the sea and up slope are warmer. The Continent in general is BELOW AVERAGE in temperatures. Canada is cooler, the Great Plains and Mid West are much cooler, etc, etc... Very interesting indeed.
Canada is cooler? This is for June;

The opposite is true for cities from Ontario east to Atlantic Canada where temperature were 1ºC to 3ºC below normal. That didn’t mean that June was “cold” for many places but we were missing a lot of those hot, muggy days that we were used to in years past. Below is an image showing the temperature anomalies (how above or below normal the temperatures were) in North America for the month of June. What is evident is the very persistent ridge in the west bringing the hot, dry weather and the trough in the east bringing the cooler, unsettled weather.


dayna1_zpsucipm9hj.jpg


News - Summer of extremes See who s had it best and worst so far - The Weather Network

Looks to me like most of Canada was above normal, with BC way above normal, and the southeast of Canada below. Once again, you flapyap without doing the research, Billy Bob.


Ummmmm..............maybe Im the asshole here but I see lots and lots of blue!!!!


Whats up with that?????:coffee:


heres the poop..........when that map above is ALL RED maybe people might start caring. There are about 50 million people in the northeast who have been freezing their balls off the last 3 winters in a row. They are not giving a shit about the temperature in Mexico City...............true story.
 
Last edited:

Forum List

Back
Top