Watching the sea ice melt in the arctic 2012!

Stratospheric Cooling and Tropospheric Warming

Posted on 1 December 2010 by Bob Guercio
This post has been revised at Stratospheric Cooling and Tropospheric Warming - Revised
Increased levels of carbon dioxide (CO2) in the atmosphere have resulted in the warming of the troposphere and cooling of the stratosphere. This paper will explain the mechanism involved by considering a model of a fictitious planet with an atmosphere consisting of carbon dioxide and an inert gas such as nitrogen at pressures equivalent to those on earth. This atmosphere will have a troposphere and a stratosphere with the tropopause at 10 km. The initial concentration of carbon dioxide will be 100 parts per million (ppm) and will be increased instantaneously to 1000 ppm and the solar insolation will be 385.906 watts/meter2. Figure 1 is the IR spectrum from a planet with no atmosphere and Figures 2 and 3 represent the same planet with levels of CO2 at 100 ppm and 1000 ppm respectively. These graphs were generated from a model simulator at the website of Dr. David Archer, a professor in the Department of the Geophysical Sciences at the University of Chicago and edited to contain only the curves of interest to this discussion. The parameters were chosen in order to generate diagrams that enable the reader to more easily understand the mechanism discussed herein.

I don't WANT a fictious planet with no other constituent gases or particles than CO2 and Nitrogen. I want to know how the Combined absorption of WATER VAPOR and CO2 does not saturate in the LOWER atmos and CO2 increases in the UPPER atmos (where there IS no water vapor) don't matter.

One of blog comments pretty well sums up the frustration I'm describing..

For one thing, I'm not sure that there even would be a stratosphere (ie with temperatures increasing with height) if there was no oxygen/ozone in the atmosphere as there is in your model. So it may not make sense to talk about a warmer lower atmosphere causing an even cooler upper atmosphere in such a simplified case.

Also, I understand that other variations, in water vapour, volcanic aerosols, chlorofluorocarbons and methane concentrations, can cause temperature changes in the stratosphere.

Having said that, I don't actually doubt that rising CO2 does result in a cooling stratosphere, I'm just struggling to understand how exactly and by how much.

Crap, Flatulance, try reading some scientific material from peer reviewed journals, instead of blogs. One should seek knowledge from those more intelligent or knowledgable than themselves, not misinformation from those equally ignorant.

You MF'ing MORON!!! You just wasted my time sending me to a FUCKING BLOG SITE where the AUTHOR of the explanation admits in the Discussion section...

I'm saying a lot here but I must stress that I am very much an amateur at this and may not be totally correct.I'm also a bit tired and may not be writing very clearly.

Bob

And YOU have the BALLS to tell me read PEER REVIEWED LITERATURE!!

Hopeless Hypocrit.. And Pathetic... I need a SERIOUS answer....
 
THen WHY OldieRocks does the link you've posted THOUSANDS of times say this..


The Carbon Dioxide Greenhouse Effect

So even if water vapor in the lower layers of the atmosphere did entirely block any radiation that could have been absorbed by CO2, that would not keep the gas from making a difference in the rarified and frigid upper layers. Those layers held very little water vapor anyway. And scientists were coming to see that you couldn't just calculate absorption for radiation passing through the atmosphere as a whole, you had to understand what happened in each layer — which was far harder to calculate.

The greenhouse effect will in fact operate even if the absorption of radiation were totally saturated in the lower atmosphere. The planet's temperature is regulated by the thin upper layers where radiation does escape easily into space. Adding more greenhouse gas there will change the balance. Moreover, even a 1% change in that delicate balance would make a serious difference in the planet’s surface temperature. The logic is rather simple once it is grasped, but it takes a new way of looking at the atmosphere — not as a single slab, like the gas in Koch's tube (or the glass over a greenhouse), but as a set of interacting layers. (The full explanation is in the essay on Simple Models, use link at right.)

.

Say HUH? I thought GW predicted a COOLING in the upper atmos also.. But this kind of conflicting garbage is all over the place to explain the spectral overlap between CO2 and Water Vapor and why it still drives the majority of Climate Change.

I cannot help you understand that which you refuse to understand.

So let me get this straight. You post that link a THOUSAND Times, but you can't explain the discrepancy I produced and you don't WANT to discuss it? Do I have that right?

And you're gonna CONTINUE to shove that same link at anybody that isn't a wholesale believer.. Right?
 
So Mathew ----- Certainly we have maps of existing Arctic Ice by age. So WHERE is the reconstruction map of the Medieval Warm Period? Should exist right? Can't find one.. Although I thought I saw it in that video lecture that Old Rocks posted as I breezed thru there.

Would be cool to compare that to the satellite pix..
 
Last edited:
So Mathew ----- Certainly we have maps of existing Arctic Ice by age. So WHERE is the reconstruction map of the Medieval Warm Period? Should exist right? Can't find one.. Although I thought I saw it in that video lecture that Old Rocks posted as I breezed thru there.

Would be cool to compare that to the satellite pix..

The story in my next post says we're below the medieval. A .4c temperature increase caused 4 million square miles of ice decrease between 1979-2012 is all we can be sure of.

Still this is a mind blowing charge.:eusa_shhh:
 
Last edited:
new study in the science journal Nature says that arctic sea ice has reached the lowest levels of any time period over the past 1,450 years, dipping even lower than the sea ice losses of the Medieval Warm Period. The current sea ice losses have already lasted longer than any other decline during the study period.

"When we look at our reconstruction, we can see that the decline that has occurred in the last 50 years or so seems to be unprecedented for the last 1,450 years," said Christian Zdanowicz of the Geological Survey of Canada, one of the study's co-authors, said Wednesday in an interview with the Globe and Mail.

"It's difficult not to come up with the conclusion that greenhouse gases must have something to do with this," he added, adding that natural processes cannot account for the decline.

Sea ice is a critical component of the arctic ecosystem, with salt pockets in the ice providing an icy habitat for algae and other small life forms. These in turn sustain fish, seals, and eventually polar bears, which rely on the sea ice as a hunting platform.

The Arctic has already lost 30% of its sea ice coverage in summer. Computer models predict an ice-free Arctic in summer by 2050 unless action is taken to reduce greenhouse gas emissions.

Arctic Sea Ice Dips Below Levels of Medieval Warm Period - Polar Bears International
 
Heres the reg link Arctic sea ice in longest decline seen over past 1,450 years: study - The Globe and Mail

I can't find the study. Will look.


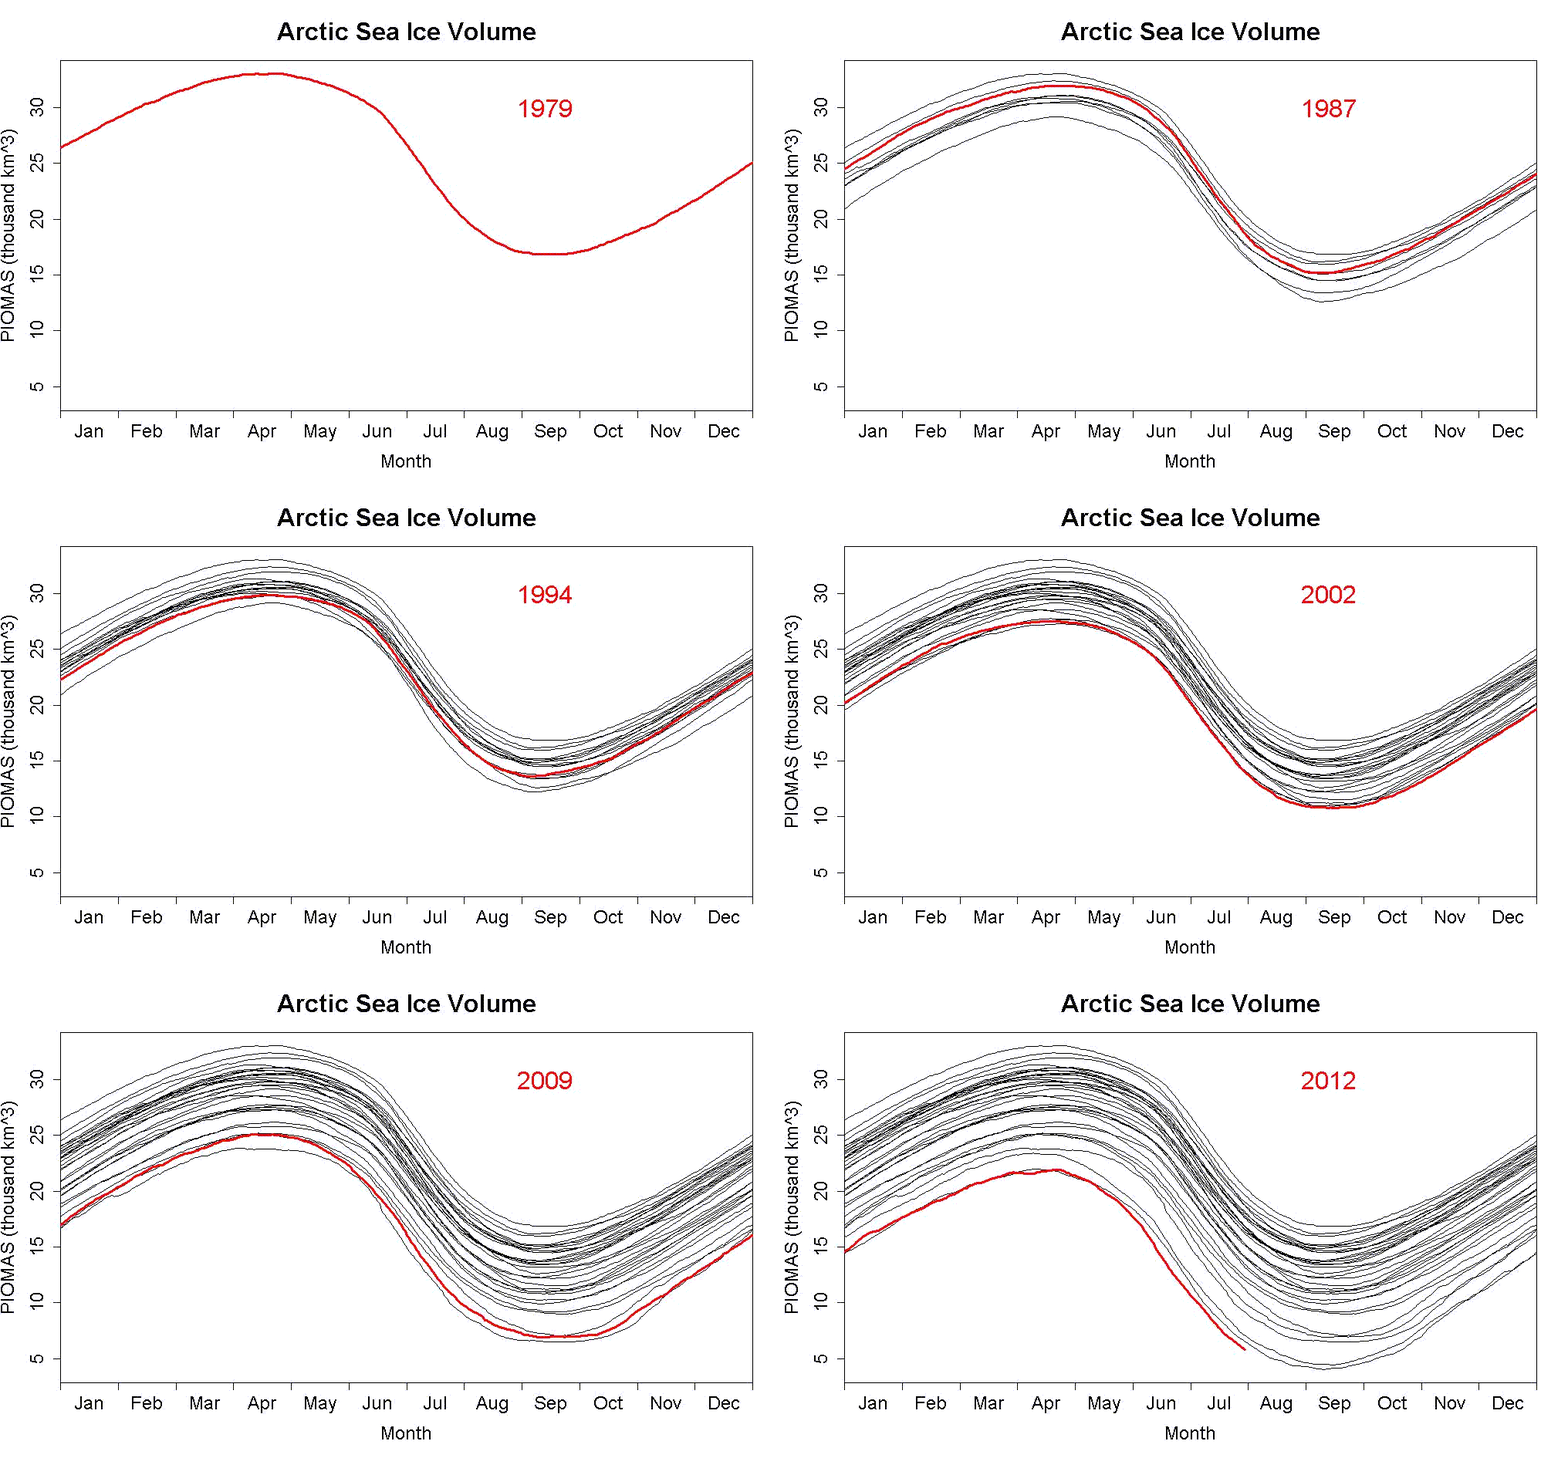
Well, heres a graph loop of volume in the last 30 years.
piomas.gif
 
found it.

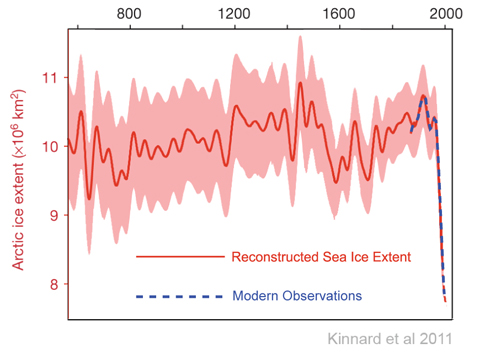
Reconstructed changes in Arctic sea ice over the past 1,450 years

Nature 479,509–512(24 November 2011)doi:10.1038/nature10581Received 24 December 2010 Accepted 21 September 2011 Published online 23 November 2011
Arctic sea ice extent is now more than two million square kilometres less than it was in the late twentieth century, with important consequences for the climate, the ocean and traditional lifestyles in the Arctic1, 2. Although observations show a more or less continuous decline for the past four or five decades3, 4, there are few long-term records with which to assess natural sea ice variability. Until now, the question of whether or not current trends are potentially anomalous5 has therefore remained unanswerable. Here we use a network of high-resolution terrestrial proxies from the circum-Arctic region to reconstruct past extents of summer sea ice, and show that—although extensive uncertainties remain, especially before the sixteenth century—both the duration and magnitude of the current decline in sea ice seem to be unprecedented for the past 1,450 years. Enhanced advection of warm Atlantic water to the Arctic6 seems to be the main factor driving the decline of sea ice extent on multidecadal timescales, and may result from nonlinear feedbacks between sea ice and the Atlantic meridional overturning circulation. These results reinforce the assertion that sea ice is an active component of Arctic climate variability and that the recent decrease in summer Arctic sea ice is consistent with anthropogenically forced warming.

kinnard.jpg


http://www.nature.com/nature/journal/v479/n7374/full/nature10581.html?mid=5374

nature10581-f3.2.jpg
 
Last edited:
There isn't a worse Melting pattern then this. August 5th through 10th pressure pattern.

index.php


index.php


Look how freaking thin the eastern Russian side is. WOW. That ice out by the straight is also fucked. Less than .25 of a meter.


Finally JAX comparing 2012, 2011, 2007
index.php


The Attament below is this year compared to 2007.
 

Attachments

  • $N_stddev_timeseries8-14.jpg
    $N_stddev_timeseries8-14.jpg
    49.7 KB · Views: 47
Last edited:
A summer storm in the Arctic

August 14, 2012
Arctic Sea Ice News and Analysis | Sea ice data updated daily with one-day lag

Arctic sea ice extent during the first two weeks of August continued to track below 2007 record low daily ice extents. As of August 13, ice extent was already among the four lowest summer minimum extents in the satellite record, with about five weeks still remaining in the melt season. Sea ice extent dropped rapidly between August 4 and August 8. While this drop coincided with an intense storm over the central Arctic Ocean, it is unclear if the storm prompted the rapid ice loss. Overall, weather patterns in the Arctic Ocean through the summer of 2012 have been a mixed bag, with no consistent pattern.

Overview of conditions


Figure 1. Arctic sea ice extent for August 13, 2012 was 4.90 million square kilometers (1.9 million square miles), 450,000 square kilometers (173,745 square miles) below the same day in 2007. The orange line shows the 1979 to 2000 median extent for that month. The black cross indicates the geographic North Pole. Sea Ice Index data. About the data

Credit: National Snow and Ice Data Center
High-resolution image

Arctic sea ice extent on August 13 was 4.90 million square kilometers (1.9 million square miles). This is 2.81 million square kilometers (1.08 million square miles) below the 1979 to 2000 average extent for the date, and is 450,000 square kilometers (173,745 square miles) below the previous record low for the date, which occurred in 2007. Low extent for the Arctic as a whole is driven by extensive open water on the Atlantic side of the Arctic, the Beaufort Sea, and—due to rapid ice loss over the past two weeks—the East Siberian Sea. Ice is near its normal (1979 to 2000) extent only off the northeastern Greenland coast. Ice near the coast in eastern Siberia continues to block sections of the Northern Sea Route. The western entrance to the Northwest Passage via McClure Strait remains blocked.

Conditions in context


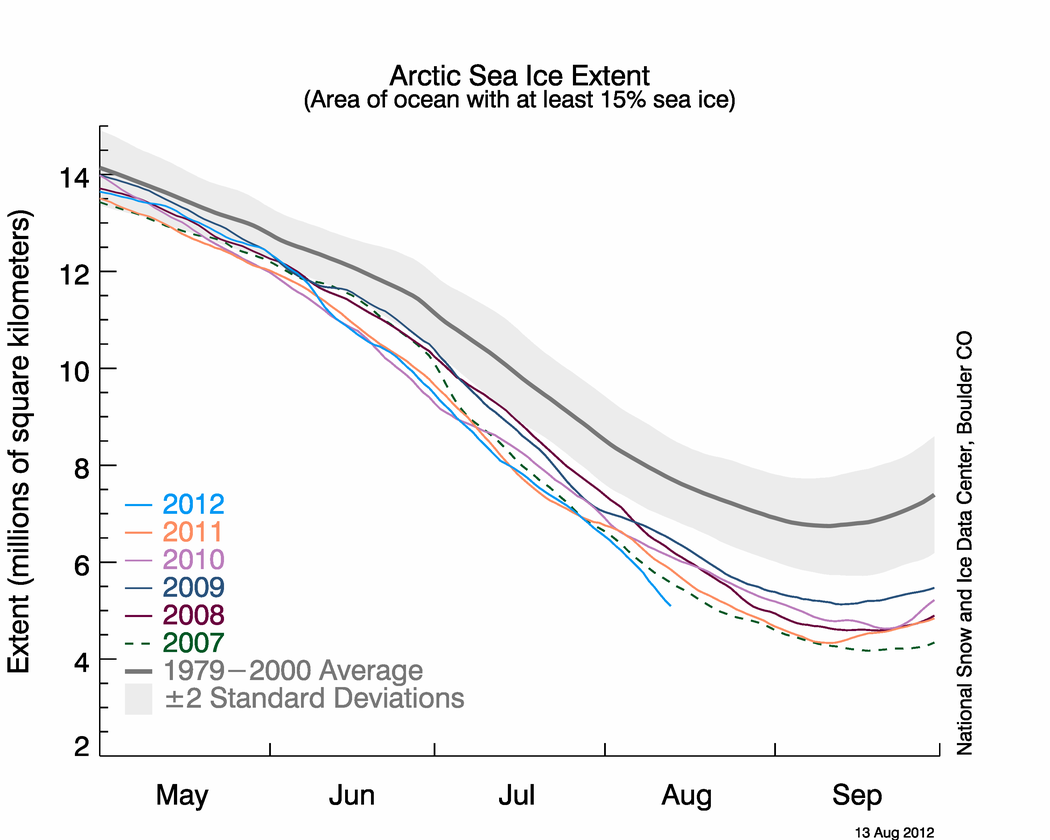
Figure 2. The graph above shows Arctic sea ice extent as of August 13, 2012, along with daily ice extent data for the previous five years. 2012 is shown in blue, 2011 in orange, 2010 in pink, 2009 in navy, 2008 in purple, and 2007 in green. The gray area around the average line shows the two standard deviation range of the data. Sea Ice Index data.

Credit: National Snow and Ice Data Center
High-resolution image

The average pace of ice loss since late June has been rapid at just over 100,000 square kilometers (38,000 square miles) per day. However, this pace nearly doubled for a few days in early August during a major Arctic cyclonic storm, discussed below. Unlike the summer of 2007 when a persistent pattern of high pressure was present over the central Arctic Ocean and a pattern of low pressure was over the northern Eurasian coast, the summer of 2012 has been characterized by variable conditions. Air tempertures at the 925 hPa level (about 3000 feet above the ocean surface) of 1 to 3 degrees Celsius (1.8 to 5.4 degrees Fahrenheit) above the 1981 to 2012 average have been the rule from central Greenland, northern Canada, and Alaska northward into the central Arctic Ocean. Cooler than average conditions (1 to 2 degrees Celsius or 1.8 to 3.6 degrees Fahrenheit) were observed in a small region of eastern Siberia extending into the East Siberian Sea, helping explain the persistence of low concentration ice in this region through early August.

The Great Arctic Cyclone of 2012


Figure 3. This subsection of the surface weather analysis from the Canadian Meteorological Centre for August 6, 2012 (at 0600 Greenwich Mean Time) shows a very strong cyclone over the central Arctic Ocean north of Alaska. The isobars (lines of equal pressure) are very tightly packed around the low pressure system, indicating strong winds. Greenland is on the right side of the figure while Canada is at the bottom.

Credit: Canadian Meteorological Centre
High-resolution image

A low pressure system entered the Arctic Ocean from the eastern Siberian coast on August 4 and then strengthened rapidly over the central Arctic Ocean. On August 6 the central pressure of the cyclone reached 964 hPa, an extremely low value for this region. It persisted over the central Arctic Ocean over the next several days, and slowly dissipated. The storm initially brought warm and very windy conditions to the Chukchi and East Siberian seas (August 5), but low temperatures prevailed later.


Figure 4. These maps of sea ice concentration from the Special Sensor Microwave Imager/Sounder (SSMIS) passive microwave sensor highlight the very rapid loss of ice in the western Arctic (northwest of Alaska) during the strong Arctic storm. Magenta and purple colors indicate ice concentration near 100%; yellow, green, and pale blue indicate 60% to 20% ice concentration.

Credit: National Snow and Ice Data Center courtesy IUP Bremen
High-resolution image

Low pressure systems over the Arctic Ocean tend to cause the ice to diverge or spread out and cover a larger area. These storms often bring cool conditions and even snowfall. In contrast, high pressure systems over the Arctic cause the sea ice to converge. Summers dominated by low pressure systems over the central Arctic Ocean tend to end up with greater ice extent than summers dominated by high pressure systems.

However, the effects of an individual strong storm, like that observed in early August, can be complex. While much of the region influenced by the August cyclone experienced a sudden drop in temperature, areas influenced by winds from the south experienced a rise in temperature. Coincident with the storm, a large area of low concentration ice in the East Siberian Sea (concentrations typically below 50%) rapidly melted out. On three consecutive days (August 7, 8, and 9), sea ice extent dropped by nearly 200,000 square kilometers (77,220 square miles). This could be due to mechanical break up of the ice and increased melting by strong winds and wave action during the storm. However, it may be simply a coincidence of timing, given that the low concentration ice in the region was already poised to rapidly melt out.

Figure2Aug13.png
 
Last edited:
Thanks for posting this but rw's have their heads stuck up their butts way too far to ever understand anything this complex.

After all, the Rs have said they are against any and all education and most recently, against critical thought.

Says it all.
 
Thanks for posting this but rw's have their heads stuck up their butts way too far to ever understand anything this complex.

After all, the Rs have said they are against any and all education and most recently, against critical thought.

Says it all.

Any time you're ready partisian hack -- there's a solution for your Global Warming (assuming CO2 is the problem) -- and that's 240 new nuclear plants to power the grid and charge your EVs..

You just let the RW engineers and scientists when you're ready to FIX the problem.. We'll get right on it...
 
Professor Jennifer Francis gave a wonderful presentation of exactly how that works. That you will not watch it, and even if your did, you would not understand it, is your problem, not mine.

Your problem is that either your head is up your own ass or up "experts" like Jennifer Francis.
Here is a much better explanation:
Arktis: Sturm lässt Eis am Nordpol verschwinden - SPIEGEL ONLINE
Riesensturm lässt Nordpol-Eis schmelzen

image-387316-panoV9-wjpu.jpg


  • Wind schiebt die Schollen in wärmere Gefilde oder zertrümmert sie.
  • Ozeanströmungen aus dem Süden schmelzen das Eis.
  • Die rhythmische Verlagerung einer Klimaschaukel über dem Atlantik, die sogenannte Nordatlantische Oszillation (NAO), bringt alle paar Jahre warme Witterung in die Arktis.
  • Der sogenannte Arktische Dipol, ein Luftdruckgefälle zwischen Nordamerika und Sibirien, bestimmt das Wetter.


Diese Faktoren waren es wohl, die dafür gesorgt haben, dass die Arktis in den dreißiger Jahren ähnlich warm war wie heute - und dass die Region im sogenannten Holozänen Klimaoptimum vor 5000 bis 8000 Jahren noch mit weitaus weniger Eis bedeckt war als heutzutage. Damals war es in der Arktis etwa drei Grad wärmer. Eine schlechte Datenlage erschwert die Prognosen: Wissenschaftler forderten bereits die Herausgabe der Daten von Spionagesatelliten, um den Wandel am Nordpol besser zu dokumentieren. Doch Taupfützen auf dem Eis gaukeln Satelliten mitunter offenes Meer vor, wo eigentlich noch Eis liegt. Ein weiteres Manko: Satelliten messen lediglich die Oberfläche des Eises; die Dicke der Schollen kennen Forscher nur aus Messungen von vor Ort.
Translation:
Natural phenomena that "melted" the ice..
1.) Ice breaking up due to wind (and tidal)
2.) Fractured ice is pushed by the winds into warmer regions
3.) The northern oscillation "NAO" brings warm air with each cycle
4.) The "arctic di-pole" which is the pressure differential between North America and Siberia is the largest factor concerning arctic temperatures.


same article
These factors were the same that were responsible when the arctic ice cover and temperatures were the same during the 1930`s as they are today
and that 5000 years ago the ice cover was only a fraction of what it is today
Guess what..these trees I photographed when I was on Greenland and Ellesmere Island...:
scaled.php


They have been carbon dated to be between 5000 and 9000 years old !


and:
Scientists demand the disclosure of "spy" satellite data due to a lack of reliable data from conventional satellites which are unable to measure ice thickness...but worse, present a few scattered melt water ponds as huge areas of open ocean...!!!

http://en.wikipedia.org/wiki/Der_Spiegel
It is known in Germany for its distinctive, academic writing style and its large volume—a standard issue may run 200 pages or more. Typically, it has a content to advertising ratio of 2:1. As of 2010[update], Der Spiegel was employing the equivalent of 80 full-time fact checkers, which the Columbia Journalism Review called "most likely the world's largest fact checking operation".[4]
 
Last edited:
Arctic Ocean contributes to Arctic amplification by losing heat to atmosphere when sea ice retreats

Heat budget of the upper Arctic Ocean under a warming climate – Graham & Vellinga (2012)
Abstract: “The heat budget of the upper Arctic Ocean is examined in an ensemble of coupled climate models under idealised increasing CO2 scenarios. All of the experiments show a strong amplification of surface air temperatures but a smaller increase in sea surface temperature than the rest of the world as heat is lost to the atmosphere as the sea-ice cover is reduced. We carry out a heat budget analysis of the Arctic Ocean in an ensemble of model runs to understand the changes that occur as the Arctic becomes ice free in summer. We find that as sea-ice retreats heat is lost from the ocean surface to the atmosphere contributing to the amplification of Arctic surface temperatures. Furthermore, heat is mixed upwards into the mixed layer as a result of increased upper ocean mixing and there is increased advection of heat into the Arctic as the ice edge retreats. Heat lost from the upper Arctic Ocean to the atmosphere is therefore replenished by mixing of warmer water from below and by increased advection of warm water from lower latitudes. The ocean is therefore able to contribute more to Arctic amplification.”
Citation: Tim Graham and Michael Vellinga, Climate Dynamics, 2012, DOI: 10.1007/s00382-012-1454-5.

AGW Observer
 
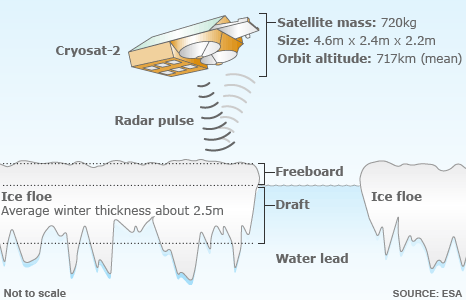
An explanation of Cryosat for the scientifically challenged among us.

BBC News - Cryosat mission's new views of polar ice

Which is the category that describes you best.
Is that supposed to be a response to :
Eine schlechte Datenlage erschwert die Prognosen: Wissenschaftler forderten bereits die Herausgabe der Daten von Spionagesatelliten, um den Wandel am Nordpol besser zu dokumentieren. Doch Taupfützen auf dem Eis gaukeln Satelliten mitunter offenes Meer vor, wo eigentlich noch Eis liegt. Ein weiteres Manko: Satelliten messen lediglich die Oberfläche des Eises; die Dicke der Schollen kennen Forscher nur aus Messungen von vor Ort.
That the conventional satellites can only measure the surface ice but are not able to measure ice thickness...
Even the "scientifically" challenged should at least be able to read (in English) that BBC article and realize:
BBC News - Cryosat mission's new views of polar ice
How to measure sea-ice thickness from space

_48209615__46390440_cryosat466-1.gif
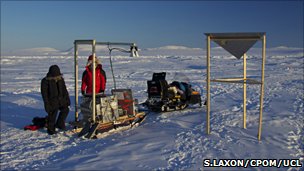
That this is exactly what the article I quoted said...that conventional satellites can`t measure ice thickness...only the ice above the waterline...!!!....and not the rest. Are you that "challenged" that you don`t know the meaning of "Average ice thickness about 2.5 meters"...???...and that was "determined" by drilling a few holes and not by satellite:
_53540925_validate.jpg


During summer ....!!!!
(else there would not be daylight)

Also have you ever wondered how far from "home base" you can get with a snow mobile...

I`ve been up there and these guys who drill into the ice stay on our base...so I do know how far they did go out...max 30 km...!!!
and the rest of the huge area is "averaged"
I even recognize the hills in the background...it`s called the "Crystal Mountain Range"


Same article:
For Cryosat, it is another illustration of its capability. Radar satellites have traditionally struggled to discern the detail in the steep slopes and ridges that mark the edges of ice sheets,
So before that, on what EXACTLY was the data which was used for all these trend graphs based..???

Short answer...the usual "climatology averaging"...!!
Cryosat found the volume (area multiplied by thickness) of sea ice in the central Arctic in March 2011 to have been 14,500 cubic kilometres. This figure is very similar to that suggested by PIOMAS (Panarctic Ice Ocean Modeling and Assimilation System), an influential computer model that has been used to estimate Arctic sea ice volume, and which has been the basis for several predictions about when summer sea ice in the north might disappear completely.
The entire exercise is (as usual) to re-structure faulty data in order to "prove" that all prior publications & the "computer model" which was used to appear as credible...:
Cryosat's principal investigator, Prof Duncan Wingham - formerly of UCL but now chief executive of the UK's National Environment Research Council - summed up:...blah blah blah
2Q==

Duncan Wingham is Professor of Climate Physics at University College London, and was the first Director of the Centre for Polar Observation & Modelling. Wikipedia
So what else is new...????
The BBC does NOT EMPLOY full time fact checkers and the entire article is simply regurgitates Wingham`s and other GW alarmists latest PR crap.
But I`m glad this subject finally came up,...I have been waiting for it
Radar satellites have traditionally struggled to discern the detail in the steep slopes and ridges that mark the edges of ice sheets, but the Esa spacecraft can recover far more information thanks to a special interferometric observing mode that uses two antennas.
Because if you were not so "scientifically challenged" and had even a vague idea how that works, then you would also realize what kind of crap this "back radiation" is...where almost 1/2 the IR is supposed to come back down,....regardless of phase angle and heat us up even more.
While the not so "scientifically challenged" have been using "interferometric observing mode" for decades.
EM-waves cancel out more and more, the more they get out of phase and at a phase angle of 180 deg they cancel 100%...every monochromator be that for phased array radar or in an optical instrument is based on that principle...but in "climatology" & these "computer models that physics law does not even exits.
The entire IR regardless of the different phase angles of the emitting CO2 molecules is used in all these stupid "energy budgets"

By the way, You claim to be a millwright who works in Oregon...
but you posted here at ~7:15 am . You can`t be on night shift either because no matter which thread I read during the evening you are continuously "online" here...almost 24-but 100% 7..and you are not retired & on pension

Not only are you "scientifically challenged" but you are also a liar and a to boot, you are parasite on society and don`t go to work to earn an honest living
 
Last edited:

Forum List

Back
Top