Unemployment Worse Today than when Obama took Office
BLS Employment Situation January 2009: http://www.bls.gov/news.release/archives/empsit_02062009.pdf
BLS Employment Situation December 2013: Employment Situation Summary
Change in Unemployment
7.6% Jan 2009
6.7% Dec 2013
Difference = 0.9%
Change in Number of Unemployed
11,616,000 Jan 2009
10,351,000 Dec 2013
Difference = 1,265,000 less workers unemployed
Change in the Number of Employed
142,099,000 Jan 2009
144,586,000 Dec 2013
Difference = + 2,487,000 net jobs created
Change in Labor Force Participation Rate
65.5% Jan 2009
62.8% Dec 2013
Difference = 2.7% of the labor force stopped participating.
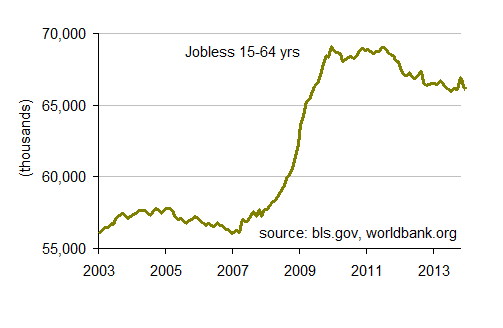
Total Not in Labor Force
49,455,000 Jan 2009
55,220,000 Dec 2013
Difference = 5,765,000 people dropped out of the labor force.
Jobs to Dropouts
Average net Jobs Created Per Year: 497,400
Average # of Labor Force Dropouts per Year: 1,153,000
Difference: For Every 1 net job created under Obama 2.32 people have given up looking for work.
Since Obama took office in 2009 the unemployment rate has dropped 0.9% and the labor force participation rate has dropped 2.7%.
Had the labor force participation rate stayed the same our current employment situation would be an unemployment rate of 9.4%, a total difference of -1.8% employment since Obama took office. In real numbers, Obama can boast that 2,487,000 net jobs were created for Americans under his stewardship in 5 years (497,400 net jobs per year average). He can also boast that those eligible for work and able to work while not looking for work increased by 5,765,000 (A labor force participation drop out rate of 1,153,000 per year). In other words, for every net job created since January 2009, 2.32 people have given up looking for work. If we were to start on the month Obama took office, fair or not, and compared the employment situation to today, we are still worse off today in terms of employment than the day he took office.
Conclusion: Ceteris paribus (and they are not) Thus far, though we look to be catching up and the economy is growing, the economy has not grown enough in accordance with the increase in workforce population so as to maintain an employment rate that would be less than that of when Obama took office.
I hope I used ceteris paribus correctly

Your Thoughts?