As I can see, some of YOUR NUMBERS posted here are a crock of sh-t.
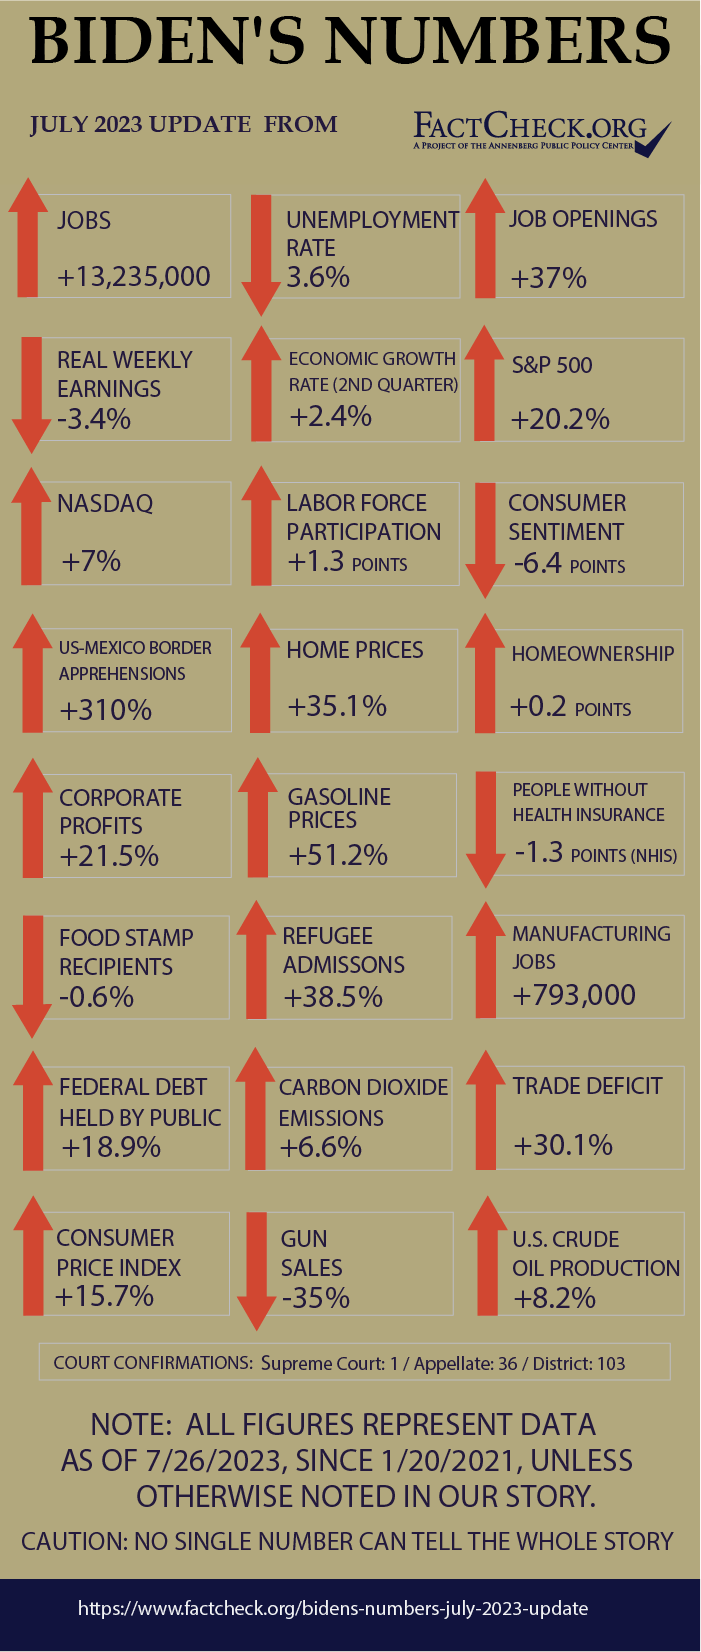
These numbers don't make any sense. For example, with your Biden numbers, economic growth rate (2nd quarter) is shown as 2.4%. Looking at the numbers fom Biden's Labor Dept (BEA), there is no 2.4% rate showing for ANY quarter when Biden was president.
View attachment 862660
Here is the fact check of your "fact check".
1. Biden's first 5 quarters show good GDPs, but they are a carryover from Trumps 2020 Q3 when he had 35.2% (biggest % ever).
2. After living off Trump's coattailsfor a year, finally Biden was on his own, and the numbers showed how drastically awful his economy was.
3. 2022 had 6 months of MINUS GDP growth, followed by 2 consecutive recessions of consistently dropping GDPs > 2.7.....2.6.....2.2......2.1
4. So now we're expected to believe that suddenly somehow the bungling Bidens have found the formula and GDP has risen to 4.9% in 2023 Q3. HA HA HA. yeah


5. Actually, this is just a case wherin sleepy Joey woke up from his slumber, and realized HIS Labor Dept (BEA) was reporting the REAL (and really bad) numbers of his terrible economy. You can expect the numbers to look good from here on out, now that HIS BEA boys got taken to the woodshed for reporting the truth. Biden won't let that happen again.
If we look at the oil production numbers, >>
Here's the whole scoop from top to bottom. It shows Trump, by far, outperforming Biden on oil production.
Biden's production is a
major reduction from what Trump's production was, and even much more major, when we extrapolate Trump's rising line to January 2023, if he had retained the presidency.
Oil production overall not only increased, during the Trump administration, it soared, and was vastly greater than the production we've gotten with Biden.
Trump production
December 2019 -
402.3 Million Barrels/month
January 2020 -
398.4
And Trump exceeded Biden's top month of
371.2 Million Barrels/month
NINE TIMES, despite the Obama low production influences and later, the pandemic months reductions. And note also that Biden's top production month of
371.2, was recently in August of 2022, when he started increasing production, to try to lower gas prices, as we started getting closer to the 2022 ELECTION.
Biden's 2021 average is
341 Million Barrels/month compared to Trump's
374.
Biden's 2022 average (when he ramped up production as the 2022 election drew closer) wasn't much better >
354.
| | | | | | | | | | | | |
| | | | | | | | | | | | 8 |
| 2017 | 275,117 | 255,081 | 284,146 | 273,041 | 284,727 | 273,321 | 286,657 | 286,759 | 285,499 | 299,726 | 302,564 | 309,486 |
| 2018 | 310,032 | 287,870 | 324,467 | 314,996 | 323,491 | 319,216 | 337,814 | 353,154 | 343,298 | 356,767 | 356,583 | 370,284 |
| 2019 | 367,924 | 326,845 | 369,292 | 364,458 | 376,763 | 366,546 | 368,965 | 387,073 | 377,710 | 397,094 | 390,010 | 402,314 |
| | | | | | | | | | | | |
| 2020 | 398,420 | 372,419 | 396,693 | 357,412 | 301,105 | 313,275 | 341,184 | 327,875 | 327,623 | 324,180 | 335,867 | 346,223 |
| 2021 | 344,846 | 277,891 | 351,102 | 339,142 | 352,036 | 340,693 | 351,757 | 349,600 | 327,526 | 358,626 | 353,702 | 360,666 |
| 2022 | 352,449 | 316,851 | 362,725 | 350,052 | 360,503 | 353,918 | 367,164 | 371,339 | 368,040 | | | |
U.S. Field Production of Crude Oil (Thousand Barrels)
AND, if we extrapolate the EIA graph curve of Trump to now (Dec. 2022) if Trump were still president, it would be whopping
580 Million Barrels/month - HUNDREDS of Barrels/month more than Biden ever allowed produced.
U.S. Field Production of Crude Oil (Thousand Barrels)
Look at the graph line where it peaked at
402 Million Barrels/mo in December of 2019. Because of the climb up to that point, there is every reason to believe, that had the pandemic shutdowns not occured,
that rising line would have continued rising exactly as it was already doing. And if Trump had remained president, and we thereby
extend-extrapolate the line to as far as December 2022, we can easily see that it would be at about
580 Million Barrels/mo
(209 million Barrels/mo more than Biden's measly 371 Million).
Go ahead - put a ruler on the line that starts at 2017 when Trump took over, and look at where it goes to for December 2022 > 580 Million
All one need do to see the stark difference between the oil-friendly Trump and the oil-hostile Biden, is look at the
NOSEDIVE oil production took between Trump's last month, and Biden's first month (when he issued an EO to halt oil drilling)
Trump's last month in office was January 2021 - production wa
s 344 MB/mo. Bidens first month was
277.
A DROP of a whopping 67 MB/mo Sure, because that was right after Biden issued EOs cancelling oil leases
Biden signs executive order pausing federal drilling leases
But we knew all this was going to happen, when Biden told us (during the 2020 debate with Trump) that he was going to "transition" away from fossil fuels, and that's just what he's done, thereby giving us the worst inflation in 40 years,
8th grade schoolkids can tell you that when you decrease supply, prices increase. But in this case, it's not just the one commodity of gas prices at the pump. When gas/deisel prices jump up, ALL prices go up, because manufacturers now have to pay more to transport their goods to stores. Guess who gets hit with those increases.

As for rental housing inflation, its off the chart. 100-200% since Biden took over.
When Trump left office inflation was 1.4%. Look at the graph >>
View attachment 862664