You're just full of those idiotic denier cult myths, aren't you, SSoooooDDumb? This particular myth has been recently fueled by a fallacious article by denier cult douche-bag David Rose which claimed that data from the British Met Office showed no warming for the last 16 years. Totally bogus, of course, but fuel for your denier cult fantasies.
In response to the factual errors in Rose's propaganda piece/newspaper article, the Met Office posted an official response. Here is the official Met Office press release - which, BTW, is a government press release, is not copyrighted, and is free to reproduce in full.
Met Office in the Media: 14 October 2012
Met Office News Blog - the official blog of the Met Office news team
10/14/2012
An article by David Rose appears today in the Mail on Sunday under the title: Global warming stopped 16 years ago, reveals Met Office report quietly released
and here is the chart to prove it
It is the second article Mr Rose has written which contains some misleading information, after he wrote an article earlier this year on the same theme you see our response to that one here.
To address some of the points in the article published today:
Firstly, the Met Office has not issued a report on this issue. We can only assume the article is referring to the completion of work to update the HadCRUT4 global temperature dataset compiled by ourselves and the University of East Anglias Climate Research Unit.
We announced that this work was going on in March and it was finished this week. You can see the HadCRUT4 website here.
Secondly, Mr Rose says the Met Office made no comment about its decadal climate predictions. This is because he did not ask us to make a comment about them.
You can see our full response to all of the questions Mr Rose did ask us below:
Hi David,
Heres a response to your questions. Ive kept them as concise as possible but the issues you raise require considerable explanation.
Q.1 First, please confirm that they do indeed reveal no warming trend since 1997.
The linear trend from August 1997 (in the middle of an exceptionally strong El Nino) to August 2012 (coming at the tail end of a double-dip La Nina) is about 0.03°C/decade, amounting to a temperature increase of 0.05°C over that period, but equally we could calculate the linear trend from 1999, during the subsequent La Nina, and show a more substantial warming.
As weve stressed before, choosing a starting or end point on short-term scales can be very misleading. Climate change can only be detected from multi-decadal timescales due to the inherent variability in the climate system. If you use a longer period from HadCRUT4 the trend looks very different. For example, 1979 to 2011 shows 0.16°C/decade (or 0.15°C/decade in the NCDC dataset, 0.16°C/decade in GISS). Looking at successive decades over this period, each decade was warmer than the previous so the 1990s were warmer than the 1980s, and the 2000s were warmer than both. Eight of the top ten warmest years have occurred in the last decade.
Over the last 140 years global surface temperatures have risen by about 0.8ºC. However, within this record there have been several periods lasting a decade or more during which temperatures have risen very slowly or cooled. The current period of reduced warming is not unprecedented and 15 year long periods are not unusual.
Q.2 Second, tell me what this says about the models used by the IPCC and others which have predicted a rise of 0.2 degrees celsius per decade for the 21st century. I accept that there will always be periods when a rising gradient may be interrupted. But this flat period has now gone on for about the same time as the 1980 1996 warming.
The models exhibit large variations in the rate of warming from year to year and over a decade, owing to climate variations such as ENSO, the Atlantic Multi-Decadal Oscillation and Pacific Decadal Oscillation. So in that sense, such a period is not unexpected. It is not uncommon in the simulations for these periods to last up to 15 years, but longer periods are unlikely.
Q.3 Finally, do these data suggest that factors other than CO2 such as multi-decadal oceanic cycles may exert a greater influence on climate than previously realised?
We have limited observations on multi-decadal oceanic cycles but we have known for some time that they may act to slow down or accelerate the observed warming trend. In addition, we also know that changes in the surface temperature occur not just due to internal variability, but are also influenced by external forcings, such as changes in solar activity, volcanic eruptions or aerosol emissions. Combined, several of these factors could account for some or all of the reduced warming trend seen over the last decade but this is an area of ongoing research.
The below graph which shows years ranked in order of global temperature was not included in the response to Mr Rose, but is useful in this context as it illustrates the point made above that eight of the warmest years on record have occurred in the past decade.
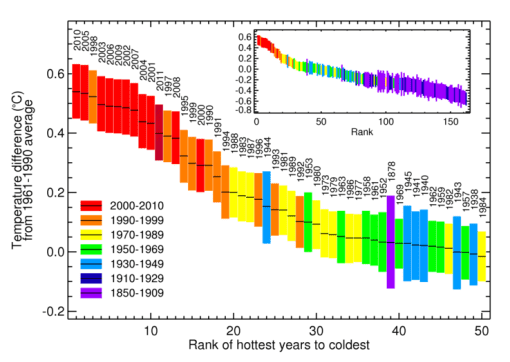
Graph showing years ranked in order of global temperature.


