ScienceRocks
Democrat all the way!
- Banned
- #1
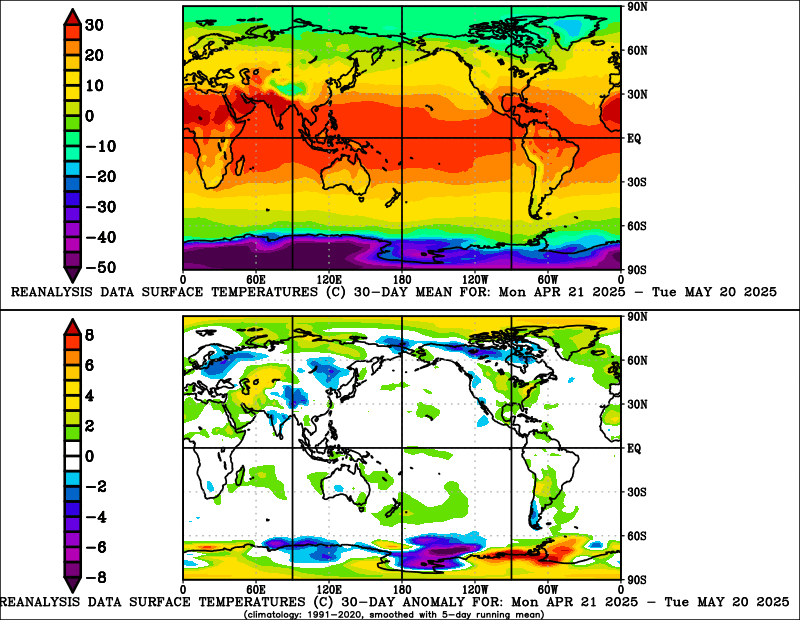
Here is a map of the past 30 days....What do you see?
1# That the area of warmer then "means/avg"l is much larger then the colder then normal temperatures.
2# The intensity of the warmer then the "means" area is more severe...Look over Antarctica with the -6 above means to the small -4 to -6c areas...Much larger within scope within the larger geographical area. This is what gets added together by hundreds of land stations, buoy's, ship reports to make up the warm anomaly we see at the giss, noaa. Or of course the trillions of points on the earth that the satellite carrying the rss and uah looks at.

This is why that is so.
Lets see, parts of northwestern Antarctica and south America or notably below the means, but area's 3 times there size are above it...And within some cases far more above normal then the cold area's. Like I said above, this is why one area doesn't make global climate as it is only a point or a few points within it. Of course it gets factored into it, but when you have a much larger part of the global that is above means then you still have a warmer anomaly overall.
Texas is one of those points,
South America is another
California for much of the summer is another
The Arctic is another
The Antarctic is yet another
Lets say the overall warm anomaly's are much bigger(covering a larger percentage of the globe) with a max anomaly over a much bigger percentage of there area being +4 to 6c above normal. Lets say that is 4 times as large as the equal cold anomalies. Seriously, the warm anomalies are over powering the cold ones...Avging the global temperature to above normal for the baseline.
How does it avg as a whole? That is what the global means within global warming.
Case in point
60 percent of the earth is near the avg within -1c to +1c
30 percent of the earth is above the avg +1c to +6c
10 percent of the earth is below the avg -1c to -6c
The weight favors a above normal anomaly...And as you go into the future this will weigh heavier and heavier in that favor if you're dealing with a warming planet.
Seriously, can all this data be wrong? Somehow if so, how could we even tell one way or the other...That on this scale(Global) that is so? Being that a area of below normal for days, weeks, months or even years doesn't tell the global scale story of what is going on. The UK the past few winters surely didn't tell the story any more then the antarctic now or the arctic last winter did.

1# That the area of warmer then "means/avg"l is much larger then the colder then normal temperatures.
2# The intensity of the warmer then the "means" area is more severe...Look over Antarctica with the -6 above means to the small -4 to -6c areas...Much larger within scope within the larger geographical area. This is what gets added together by hundreds of land stations, buoy's, ship reports to make up the warm anomaly we see at the giss, noaa. Or of course the trillions of points on the earth that the satellite carrying the rss and uah looks at.

This is why that is so.
Lets see, parts of northwestern Antarctica and south America or notably below the means, but area's 3 times there size are above it...And within some cases far more above normal then the cold area's. Like I said above, this is why one area doesn't make global climate as it is only a point or a few points within it. Of course it gets factored into it, but when you have a much larger part of the global that is above means then you still have a warmer anomaly overall.
Texas is one of those points,
South America is another
California for much of the summer is another
The Arctic is another
The Antarctic is yet another
Lets say the overall warm anomaly's are much bigger(covering a larger percentage of the globe) with a max anomaly over a much bigger percentage of there area being +4 to 6c above normal. Lets say that is 4 times as large as the equal cold anomalies. Seriously, the warm anomalies are over powering the cold ones...Avging the global temperature to above normal for the baseline.
How does it avg as a whole? That is what the global means within global warming.
Case in point
60 percent of the earth is near the avg within -1c to +1c
30 percent of the earth is above the avg +1c to +6c
10 percent of the earth is below the avg -1c to -6c
The weight favors a above normal anomaly...And as you go into the future this will weigh heavier and heavier in that favor if you're dealing with a warming planet.
Seriously, can all this data be wrong? Somehow if so, how could we even tell one way or the other...That on this scale(Global) that is so? Being that a area of below normal for days, weeks, months or even years doesn't tell the global scale story of what is going on. The UK the past few winters surely didn't tell the story any more then the antarctic now or the arctic last winter did.

Last edited:


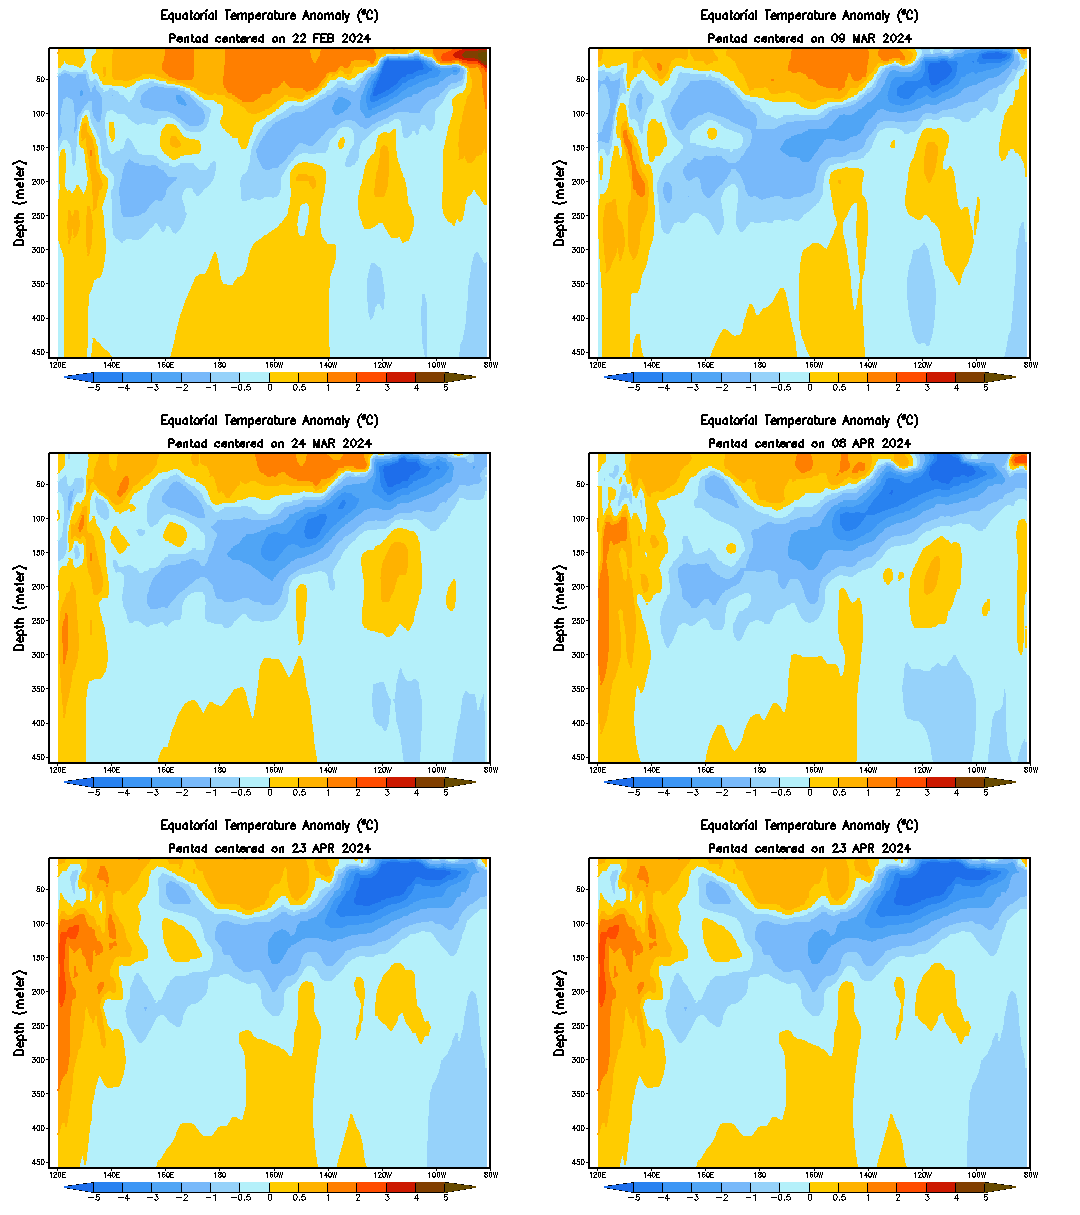
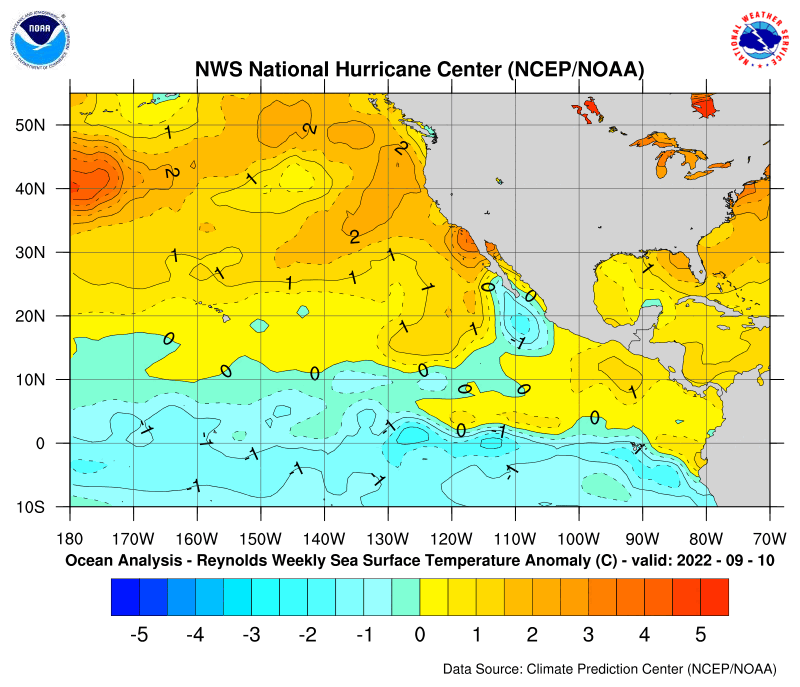
 but most of what is south of 25 between south America and hawaii is the ENSO. Yes, ocean waters with months on in of cooler then normal temperatures don't change with the every day weather patterns very fast at all.