leftwinger
Diamond Member
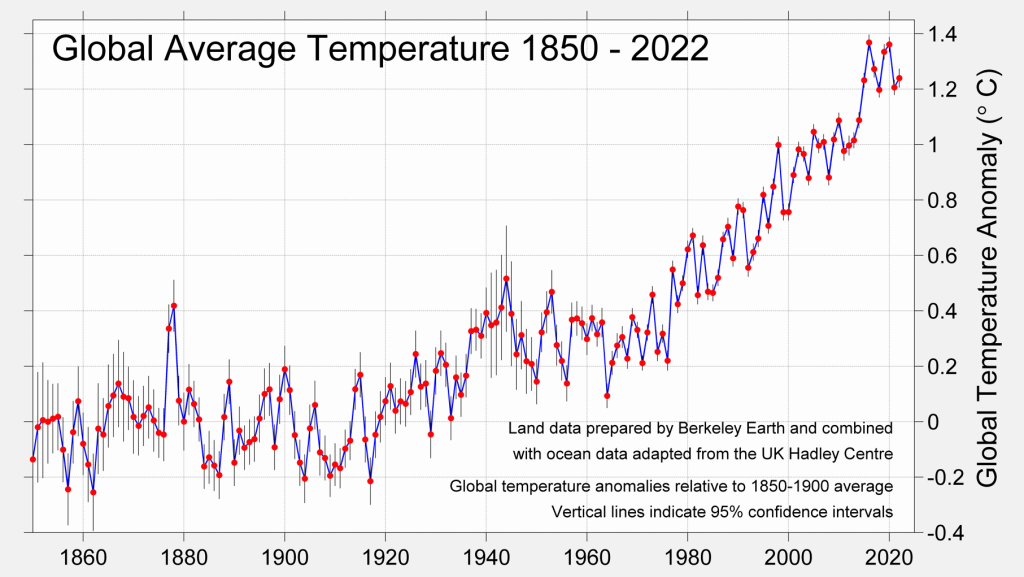
Normal TEMPERATURE "ups & downs" do not constitute any Emergency on my part. yawning deeply.
Ice ages came and went before man had tools.
Old saying: If you don’t like the weather, wait a minute always seems to hold true when discussing weather in the Midwest It will change.
Ice ages came and went before man had tools.
Old saying: If you don’t like the weather, wait a minute always seems to hold true when discussing weather in the Midwest It will change.
Last edited: