SSDD
Gold Member
- Nov 6, 2012
- 16,672
- 1,968
- 280
I like how you post up graphs without any explanation as to what it is your expecting us to see. so please, what is it you see that you want us to see?It often amazes me how often you come up with a criticism that seems to presuppose that only one factor can affect or control a phenomenon.
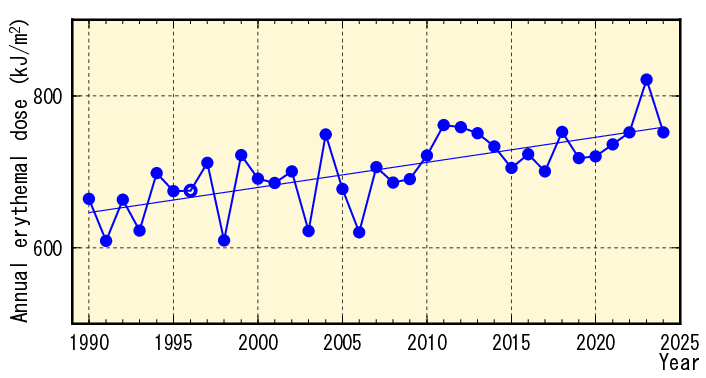
Here is some UV trend data

View attachment 240442
https://aip.scitation.org/doi/pdf/10.1063/1.4975572
None of these support your contention. Since, despite repeated requests, you have declined to provide any data to support your claim, I have to conclude that you saw these same data and chose not to, though you also chose to continue making your claim. That would be what we might call "being dishonest".
And is 3 parts per billion more or less than 780,000 parts per million? come on crickster, you still haven't answered.
His graphs are only looking at total energy...not the particular wavelengths that are responsible for the production of O3..his graphs are good enough to fool him...hell he doesn't even know why they are useless when you are talking about variations in particular wavelengths in the UV band.