Glacial mass balance model estimates 3,056 MCM/yr of glacial melt for 2002–2015, 78% of the meltwater flows westward Decreasing glacial mass is compensated by increasing groundwater mass in the tot...

agupubs.onlinelibrary.wiley.com
Abstract
As a result of global climate change, glacial melt occurs worldwide. Major impacts are expected on the dynamics of aquifers and rivers in and downstream of mountain ranges. This study aims at quantifying the melt water input fluxes into the watersheds draining the Canadian Rocky Mountains and improving our knowledge about the fate of meltwater within the hydrological cycle. To this end, we use (1) time‐variable gravity data from GRACE satellites that are decomposed into water storage compartments; (2) an ensemble of glacier information: in situ observations, geodetic measurements, and a mass balance model; and (3) in situ surface water and groundwater level observations. The glacier mass balance model estimates a total ice mass change of ~43 Gt for the period 2002–2015, corresponding to an average of −3,056 (±2,275) MCM/yr (million cubic meters per year). 78% of the meltwater total flows west of the continental divide (to the Pacific Ocean), while 22% flows east of the continental divide (to the Arctic Ocean and Hudson Bay). However, the GRACE‐derived total water storage increases, suggesting that groundwater storage compensates for the glacial melt with an increase of 3,976 (±2,819) MCM/yr. A plausible explanation is that meltwater is not immediately flowing down in rivers but rather stored locally in aquifers. This hypothesis is supported by in situ river base flow observations, showing base flow increase in basins draining the ice melt, mostly west of the continental divide. Direct in situ evidences such as well water level time series are not sufficiently available to fully support this hypothesis.
Plain Language Summary
This study discusses glacial melt and its impacts on water resources in the Canadian Rocky Mountains. First, we quantify glacial melt inflows into the hydrological cycle flowing to the draining watersheds on both sides of the mountain range. Our melt estimation is in good agreement with previous studies. Second, we explore the fate of glacial meltwater, and in particular the changes occurring in aquifers, by comparing our melt estimates with other data sets such as geodetic gravity field time series and hydrometric data. While glacial mass change modeling estimates a relatively high mass loss for 2002–2015, geodetic observations show that groundwater storage has increased during the same period. Decreasing glacial mass is compensated by increasing groundwater mass in the total mass change derived from geodetic observation, suggesting water transfers from melting glaciers to aquifers. Field measurements support the hypothesis of a significant groundwater storage increase, but not enough field data are available to precisely and independently quantify this rise.
Glacier retreat is the main process behind Greenland Ice Sheet dynamic mass loss over the past three decades, according to an analysis of discharge variability and calving front positions.

www.nature.com
Abstract
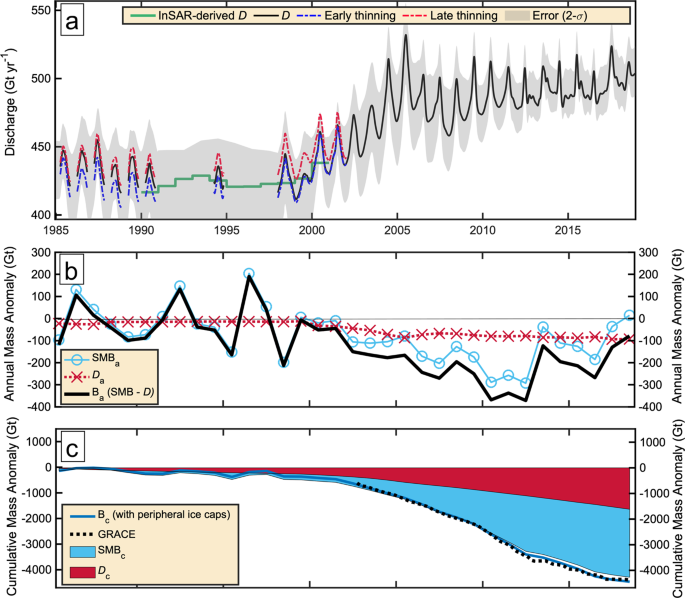
The Greenland Ice Sheet is losing mass at accelerated rates in the 21st century, making it the largest single contributor to rising sea levels. Faster flow of outlet glaciers has substantially contributed to this loss, with the cause of speedup, and potential for future change, uncertain. Here we combine more than three decades of remotely sensed observational products of outlet glacier velocity, elevation, and front position changes over the full ice sheet. We compare decadal variability in discharge and calving front position and find that increased glacier discharge was due almost entirely to the retreat of glacier fronts, rather than inland ice sheet processes, with a remarkably consistent speedup of 4–5% per km of retreat across the ice sheet. We show that widespread retreat between 2000 and 2005 resulted in a step-increase in discharge and a switch to a new dynamic state of sustained mass loss that would persist even under a decline in surface melt.
Mountain glaciers are highly sensitive to climate change. In this paper, we systematically analyzed and discussed the responses of glaciers to climate change during 1960–2017 in western China by the methods of least squares and correlation analysis. Results show that the maximum temperature...

link.springer.com
Abstract
Mountain glaciers are highly sensitive to climate change. In this paper, we systematically analyzed and discussed the responses of glaciers to climate change during 1960–2017 in western China by the methods of least squares and correlation analysis. Results show that the maximum temperature, minimum temperature, average temperature, and precipitation significantly increased in western China at the rates of 0.32°C/10a, 0.48°C/10a, 0.39°C/10a, and 11.20 mm/10a, respectively. However, the wind speed, hours of sunshine, snowfall, and snowy days displayed decreasing trends at the rates of −0.53 m/(s·10a), 3.72 h/10a, −2.90 mm/10a, and −0.10 d/10a, respectively. The annual percentage of glacier area decreased by approximately 0.42%, and the average glacier area decreased by 2.76 km2/a. Meanwhile, glacial shrinkages were greater in the Altay Mountains, Tanggula Mountains, and Qilian Mountains than in the other mountainous regions. Glacier accumulation decreased while melt volume increased at a rate of 2.7×10⁴ m3/a. The area of melt volume was 1.3 times that of the glacier accumulation area. The glacier mass balance (GMB) decreased substantially at a rate of −14.0 mm/a, whereas the equilibrium line altitude (ELA) showed an increasing trend at a rate of 0.5 mm/a. After 1997, the mass was smaller than −500.0 mm, indicating a huge loss in glaciers. Furthermore, relationships between ELA and GMB and various climatic factors were established. Temperature and precipitation demonstrated a significantly negative correlation, whereas wind speed and snowy days had significantly positive correlations with GMB. Snowy days also exhibited a remarkably negative correlation with ELA. The strong warming trend and less snowy days were thought to be the main factors leading to glacial melting, whereas the increase in precipitation, and reductions of sunshine hours and wind speed might slow glacial melting.


")