The AGW theory says that human GHG emissions are the main factor in warming observed since the Industrial Revolution.
No. There are no proofs in the natural sciences and one temperature on one day in one location barely qualifies as a fraction of an iota of evidence of global warming. And it says absolutely nothing about anthropogenicity. That makes this comment look very much like a lead in to another denier strawman argument.
Good. We seem to agree on something.
I'm surprised it was that long.
Did you mean to say "...IS a much bigger heat sink..." because heat sinks are not something you can get in and out of. But I agree that Tallahassee has lots more asphalt and lots more fuel combustion going on. But then, it also has almost constant coastal breezes. So... just as an aside, aren't humans responsible for making Tallahassee a larger heat sink than it was 80 years ago?
Tallahassee on that one day. No hotter. Check.
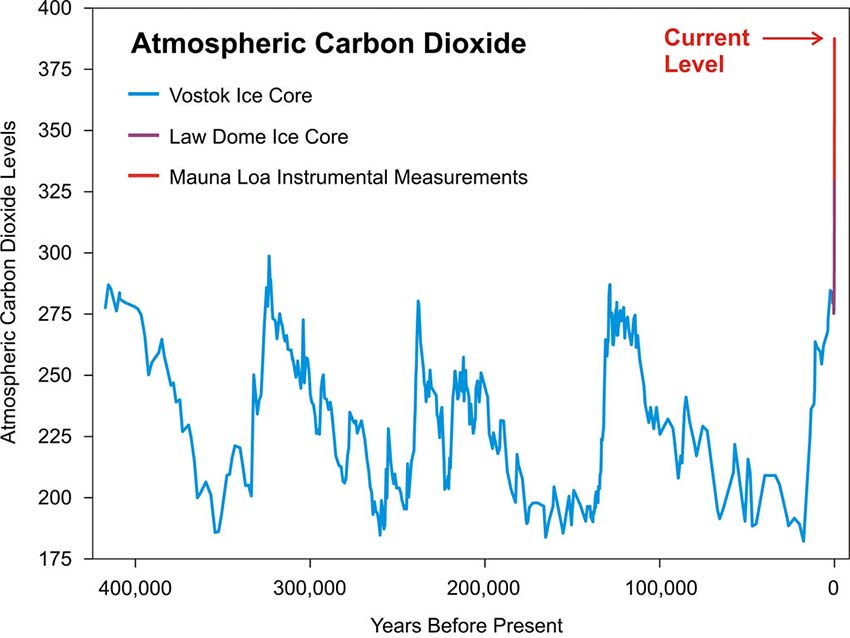
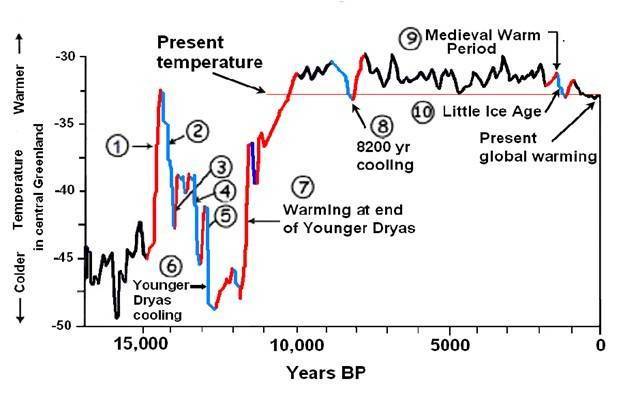
The rules here at USMB require that when you copy and paste something like this chart, you need to put up a link identifying its source. But be that as it may, let's talk about this graphic.
1) This is appears to be data from a Greenland ice core. Some Greenland ice cores are known for poorly representing abrupt glacial climate changes during precisely the period covered by your graphic. See
Greenland ice core project - Wikipedia and then
The anatomy of past abrupt warmings recorded in Greenland ice - Nature Communications
2) Typically, temperature data are acquired from ice cores by conducting an isotopic analysis of its water. The proportions of water molecules containing the oxygen 18 isotope and deuterium are temperature dependent because both, in water, require more energy to evaporate and less loss to precipitate. Since water vapor is a well-mixed gas, these temperatures are dependent on the global average temperature and do not reflect local conditions. The range of temperatures in your chart are certainly Celsius values local to central Greenland. I have looked for ways in which scientists might determine local temperatures from an ice core but have had no luck. So I would very much like to see the origin of this graphic.
3) AGW warming totals 1.1C. That would be roughly one-half of one minor division on this chart's vertical scale, yet no such rise is visible. That is very likely because it is not possible to get contemporaneous data from ice cores and, besides, the horizontal scale here is "Years BP". BP stands for "Before Present" and in this context, "Present" has a specific definition: 1950. So even had modern instrument data been appended, it would have shown only a small fraction of current warming.
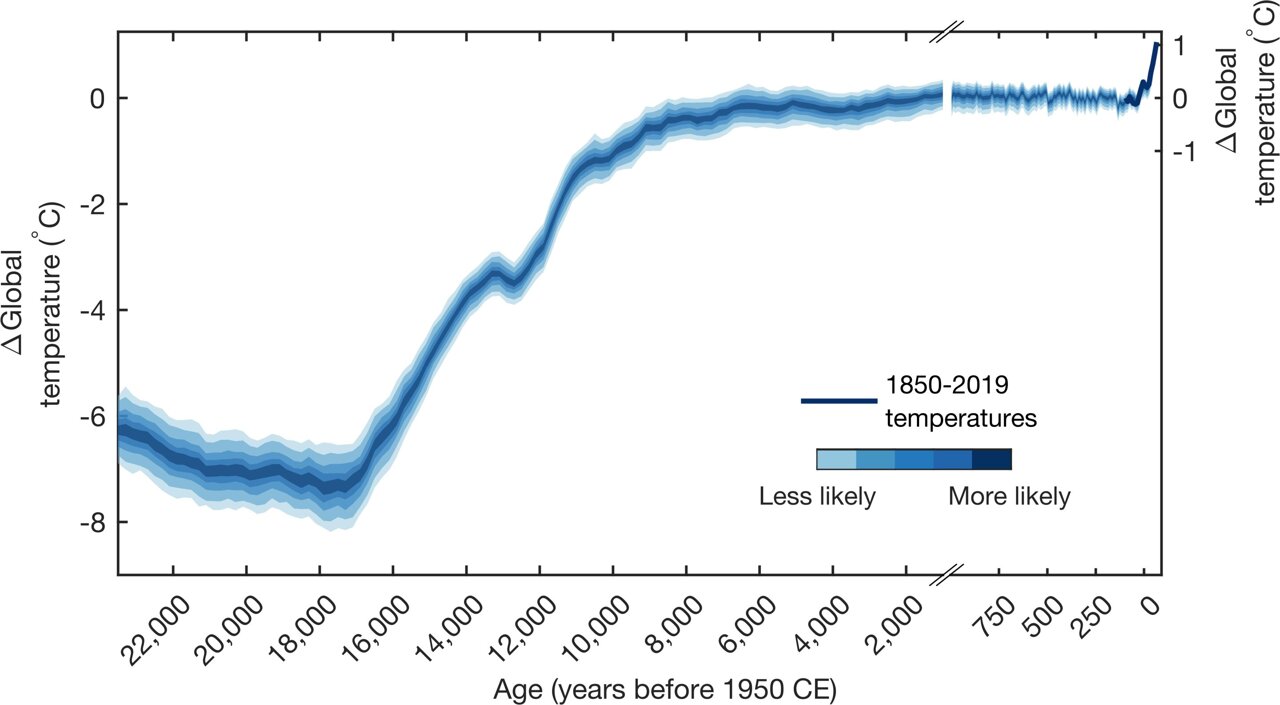
Here is a temperature reconstruction created by scientists at the University of Arizona. It is discussed in a Phys.Org article at
Global temperatures over last 24,000 years show today's warming 'unprecedented' while the study itself was published in Nature and is behind their paywall at
Globally resolved surface temperatures since the Last Glacial Maximum - Nature, though, as usual, the Abstract is available.

 www.wctv.tv

")