I've never worked for the government. Hear the pay is good. Always stuck to private industry myself.
Then you should not bite the hand that feeds you, you liberal hypocrite
The more you post the more your reveal just how stupid you really are
And quit trying to stuff your idiotic liberal "conspiracy theorist" crap in our faces here and falsify what I have said.
Like "I have no idea why you highlighted "CO2 mole fraction" for example.
perhaps you imagined that had something to do with Co2 molecules being "fractured" by the equipment?"
I never even imagined that anyone could be that stupid, not knowing what the difference is in molar ppm and ppm[v/v] or ppm[w/v] or ppm[w/w]
First of all "CO2 mole fraction" were not even my words...that was a sentence inside a quote and were from...:
Global. We added uncertainty estimates to the global CO2
18 March 2011
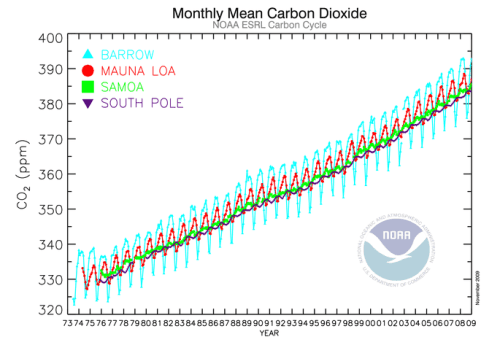
We recently recomputed the entire Mauna Loa CO2 record from the raw CO2 analyzer voltage data to
take into account small changes in assigned CO2 values of reference gases after re-calibration;
insure all CO2 mole fraction values are computed consistently throughout the record;
you knew that full well and falsified in typical liberal *** fashion who said what...
"perhaps I imagine the instrument fractures CO2 molecules"...
Reading what comes to your childish little mind when you see "CO2 mole fraction"="fractured molecules" instead of realizing what kind of cheat reporting in "molar moisture corrected ppm" as opposed to ppm (v/v) or any other absolute value shows that you lack even the most fundamental basics to understand the difference.
I`ll repeat it once again, not for you...you`ll never be able comprehend it, but for the benefit of others who are not nearly as stupid as you are.
Absolute CO2 concentration as in weight per volume drops with increasing altitude i.e. with decreasing ambient pressure.
So if you want to freak out people by saying
CO2 average =380 ppm You`ld be fucked having to use an
absolute value...because there is no way You`ld be able to show an "average"...no more than you could state what the "average cross section" of a pyramid is...unless you want to show the world how stupid you are.
So,...
this is the very reason why this quack science reports CO2 as a molar fraction...because using this format the ratio of CO2 molecules to the number of total molecules in stays the same all the way up ...and all you have to do now to white-wash this crap data collection is average the individual crap collection.
But that would never even occur to a retard like you & your retard cousins when coming across the words "molar fraction"...instead you babble about fractured molecules..
I`ll also remind all other more intelligent folks who read here, that this climate quackology not only converts absolute CO2 concentrations to "molar ppm" trying to fool you with their over-simplified averaging, but in addition also "moisture corrects" their toy instrument readings..
which further inflates the results.
CO2 Molar (fraction) ppm = G-moles CO2 divided by the sum of all other G-moles.
And "all the other G-Moles" that would be all the other gasses, like Nitrogen, Oxygen and of course Water Vapor...
So what does this con-artist-quackology do...?
They "moisture correct" the "molar ppm fraction" and then feed this crap to the unsuspecting public at large as "ppm CO2 in our atmosphere"...
Fools like You also think that when Denver and New York both report say 70% relative humidity, that there is the same amount of ABSOLUTE ppm of water vapor in the air @ Denver as in New York...
****, did you ever attend any schooling past grade 6...?
No wonder dummies like you keep falling for this "molar moisture corrected global average CO2" / "average global temperature" crap relationship, these quacks are trying to pass off as "science"
So when a "climatologist" feeds you an "average humidity" ...of a bunch of stations from coast to coast...and expressed it in RH instead of absolute humidity you`ld never even realize how you`ve been conned
Now Let`s go to your next lie...:
You quoted me as if I had said that these are CO2 levels...
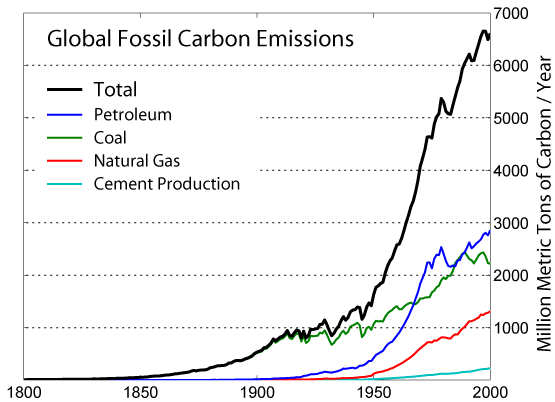
That's not even the same thing. That's rate of increase, not CO2 level.
You are so fucked up that either you believe your own lies or you are simply too stupid to comprehend plain English...
I clearly commented to this graph with these words...:
Unfortunately and as usual, these "scientists" do`nt want to show their raw source data, .....
Regardless it`s not hard to reconstruct it by simply integrating the delta values.
So it`s pretty clear you haven`t even the vaguest idea about math and what the term
"delta" of a function, graphed or expressed as an equation means.
It`s a "rate increase" you fool
As in
delta(x)=2X for F(x)=x^2,.... the
"rate increase" as someone with absolutely no background in science or math, like you would call it.
Next...:
The raw instrument data is available. Here's worldwide raw temperature data plotted in blue:
Again you haven`t even got a ******* clue what the term
"raw data" means.
Alright then I`ll explain it to you...
here is
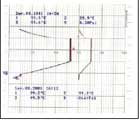
RAW DATA showing the
RAW infrared spectroscope analog output...:
Here is another example what
raw data is,...this one from a temperature strip chart recorder...:
The point of showing raw data is to allow other scientists who have to peer-review the accuracy for your findings by being able to view the RAW DATA of your measurements.
Only an idiot like you would figure this is "raw data"...:
Because you`ve seen the word "raw" on it..
****, have you any idea how many times this has been "averaged" and smoothed out before it was published for ignorant idiots just like you...?
Only in the quackology that you subscribe to does crap like that get termed "raw data"..
Not all data logging is per strip chart, much is digitized and purely numerical output ...and the RAW DATA looks like this...:
http://www.ijis.iarc.uaf.edu/seaice/extent/plot.csv
06,27,2002,-9999
06,28,2002,-9999
06,29,2002,-9999
06,30,2002,-9999
07,01,2002,10043906
07,02,2002,10007813
07,03,2002,9984844
07,04,2002,9890781
07,05,2002,9757344
07,06,2002,9671563
07,07,2002,9580000
07,08,2002,9502188
07,09,2002,9454688
07,10,2002,9382344
07,11,2002,9262344
07,12,2002,9139844
07,13,2002,9091406
And not like this "Excel" spread sheet graph produced by amateurs.
Nothing prevents "climatologists" from graphing RAW DATA...but no way will they ever do it...to this day they have not complied showing the
RAW (temperature)
DATA how they produced their hockey stick graph...
Especially not after the British Parliament started hearings if fraud charges should be laid against the authors of these publications.
Next point...:
How many more times is it necessary to stick this into your retard face before it finally sinks into your liberal simpleton-mind
that all these air sample flasks are sent to the "Scripps Institute" for "analysis" and they decide what they want to "flag" ...in other words cherry pick for their crap data collection....I posted that more than 3 times by now, showing you the Scripps URLs where that is
stated clearly in un-ambigious terms
But in typical asshole/retard fashion you write here...:
So if all these stations, aircraft measurements, tower measurements and satellite measurements are wrong, they have to be wrong because they are being faked.
Therein is why I say you are claiming a conspiracy.
Therein is a demonstration just how stupid you really are...
not only do you have a ******* clue how "climatology" is collecting the samples and that air-crews who collect some of these samples don`t analyse these on board ...but you haven`t even got the vaguest idea how that "AIRS" Satellite you keep quoting works, what it does and what it does not...
[quoteAnd of course there's the AIRS satellite. I am pretty sure it doesn't drop a scoop into the atmosphere and then post a flask to scientists on the ground to run through the imaginary only gas analyzer the human race owns.][/quote]
Because if you had the vaguest idea you would have never even mentioned it.
It`s precisely this Satellite and the measurements obtained from that Satellite which shows better than anything else how full of bullshit the quacking..duck.quack qauck-ology is, you liberal assholes quote, using idiotic school kid debating rhetoric tactics...:
So yes I am pretty sure your claims amount to conspiracy, because conspiracy is the only way it could make sense
AIRS: About_AIRS_CO2_Data
Significant Findings from AIRS Data
'Carbon dioxide is not homogeneous in the mid-troposphere; previously it was thought to be well-mixed
'The distribution of carbon dioxide in the mid-troposphere is strongly influenced by large-scale circulations such as the mid-latitude jet streams and by synoptic weather systems, most notably in the summer hemisphere
'There are significant differences between simulated and observed CO2 abundance outside of the tropics, raising questions about the transport pathways between the lower and upper troposphere in current models
'Zonal transport in the southern hemisphere shows the complexity of its carbon cycle and needs further study
That pretty well sums it up...what I`ve been saying here over and over again.
No where did I say, that CO2 has remained constant as you ******* retard-asshole-liberal-lying bastard falsified it, quoting me...
And quit trying to impress your other retard friends here with your "Googling" till you found of a graph drawn by Albert Einstein that does not start at zero on the Y-axis...
You don`t even have a clue what Equation Einstein was graphing here,...!!!!
How would you...?
You cant` even read German..neither can any of your other retard friends here...
But I can..
And the ignoramus that you are , you "thought" ...but are not capable to think...that you could stick it in my face because "Einstein" said so..
Which again shows just how ******* stupid you amateur "science expert" grand standers really are..
Einstein did not even author this paper. The Author was an Indian mathematician
Satyendra Nath Bose who sent it to Einstein who translated it into German
Einstein translated it to :
Die Quantentheorie des einatomigen idealen Gases,.....
Today known as the ..
A
BoseEinstein condensate (BEC) is a
state of matter of a dilute gas of weakly interacting
bosons confined in an external
potential and cooled to
temperatures very near
absolute zero (0 K or −273.15 °C
[1]). Under such conditions, a large fraction of the bosons occupy the lowest
quantum state of the external potential, at which point
quantum effects become apparent on a
macroscopic scale.
nd the picture you Googled for and mindlessly re-regurgitate here pretending you were some sort of science whiz-kid who studied Quantum Physics and Einstein in German shows that realtionship
near absolute Zero.
Amongst all your conspiracy theory blabbering I also spotted this..
Microsoft and others do publish "Excel for dummies"...!
Maybe you and your quacking duck "scientists" should read it...!
Every spread sheet gives you the opportunity to choose the scale & the starting point....only dummies like you use default values, because you are too stupid to figure out a proper
scaling factor....
Yes the "white space" is indeed a problem in that "global warming" con-game...
But as long as liberal default dummies believe it "white space" is simply dealt with like this...:
all you have to do is shift the "gas age" values by 83 years,falsifying the X-axis and then your crap "Windows Excel" graphs show no more embarrassing "white spaces".
So shut the **** up and get out of the way you retard, or II`ll run you over