Let's look at this from reality-
SNAP/Food Stamp Historic Trends: 1998-2010Overall Trends
Caseloads dropped through 1998 and 1999 as the economy improved and many states failed to get food stamps to low-income families who had left cash welfare for low-paid work. Caseloads then stabilized and began rising in 2000. Increases in participation since then likely have been driven by improved access to the program in states, including most recently for legal immigrants, by the weakened economy for low-income families, and (in September, October, and November 2005) by hurricanes.
Trends: 1998-2001
From December 1997 to December 2000, Food Stamps caseloads fell by 3.5 million persons. Some reduction in poverty and improvement in the overall unemployment rate contributed to these Food Stamp Program caseload declines, but other factors, including negative program changes by Congress, interactions with the cash public assistance system that make food stamp access harder for eligible families, and lack of information about the program among potentially eligible people, explained much of the drop.
Because of the 1996 welfare law, by August 22, 1997 most legal immigrants lost eligibility for federal Food Stamps benefits. Some immigrants were made newly eligible November 1, 1998, but a majority remained barred from the program. (Important additional improvements are occurring in 2003.) The period after March 1997 was also marked by implementation of cuts in Food Stamp Program eligibility for many childless, jobless adults.
Trends: 2001-2007
Unemployment and underemployment; improved processes in some states at application; better rules in many states, such as no longer treating vehicles as a resource barring eligibility; and other increased efforts by states and non-profit groups to connect eligible persons with benefits contributed to the increase in Food Stamp Program participation in this decade.
Pursuant to the 2002 Farm Bill, many legal immigrants became newly eligible for benefits in 2003 (as of April 2003, those residing in the US at least five years; as of October 2003, those under 18 regardless of date of entry).
Caseload trends in late 2005 were affected by the temporary disaster Food Stamp Program relief in the wake of several hurricanes, relief that by December was on the wane.
A positive feature of the SNAP/Food Stamp Program is its ability to meet increased need, whether due to economic changes or disasters. For information about the Disaster Food Stamp Program, download FRAC’sGuide to the Disaster Food Stamp Program; click here for a press release on the guide.
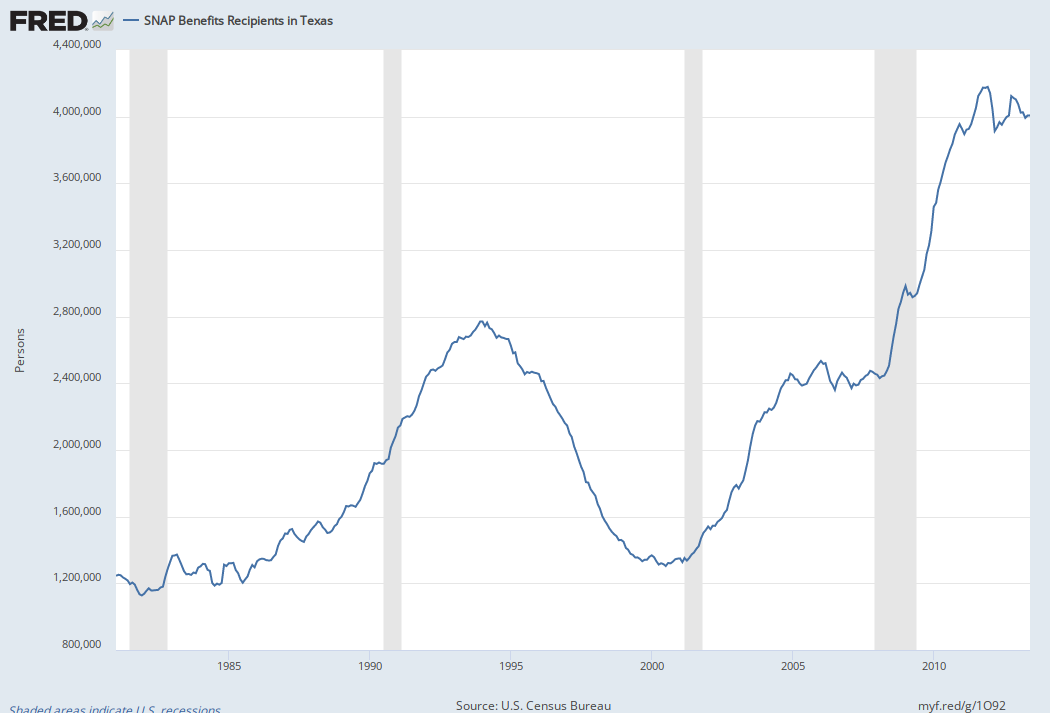
Three states with large numbers of those affected by the hurricanes– Florida, Louisiana, and Texas–accounted for nearly 3.4 million of the 3.8 million person increase between August and November 2005. Also ranking in the ten states with the largest percentage increases between August and November 2005 were three other states disproportionately impacted by hurricanes— Mississippi (hit by Katrina), Georgia and Arkansas (both reportedly serving large numbers of hurricane evacuees).
Not reflected in the caseload figures was additional nutrition assistance provided to many regular food stamp households affected by the hurricanes. Many households already enrolled in the program received replacement allotments to help cope with their food losses. Additional nutrition assistance also was provided to hurricane victims through the school meals programs, Child and Adult Care Food Program, and WIC Program.
You Lie! That is the Republican Plan. SNAP benefits skyrocketed under Bush #1 & #2. They declined under Clinton & Obama.
SNAP... LOL! Democrats believed the words 'food Stamps' were too negative, so they came up with the idea of the term 'SNAP' (Supplemental Nutrition Assistance Program), which they believed was jazzier, more up-beat - no negative connotations!
And Oh by the way, I will refrain from using your words 'YOU LIE' and just say 'YOU ARE MIS-INFORMED': Factcheck.org says Food Stamp levels continue to run at RECORD levels under Obama -- "Americans receiving food stamps
remains 45 percent HIGHER than when the president first took office"
(also according to factcheck:
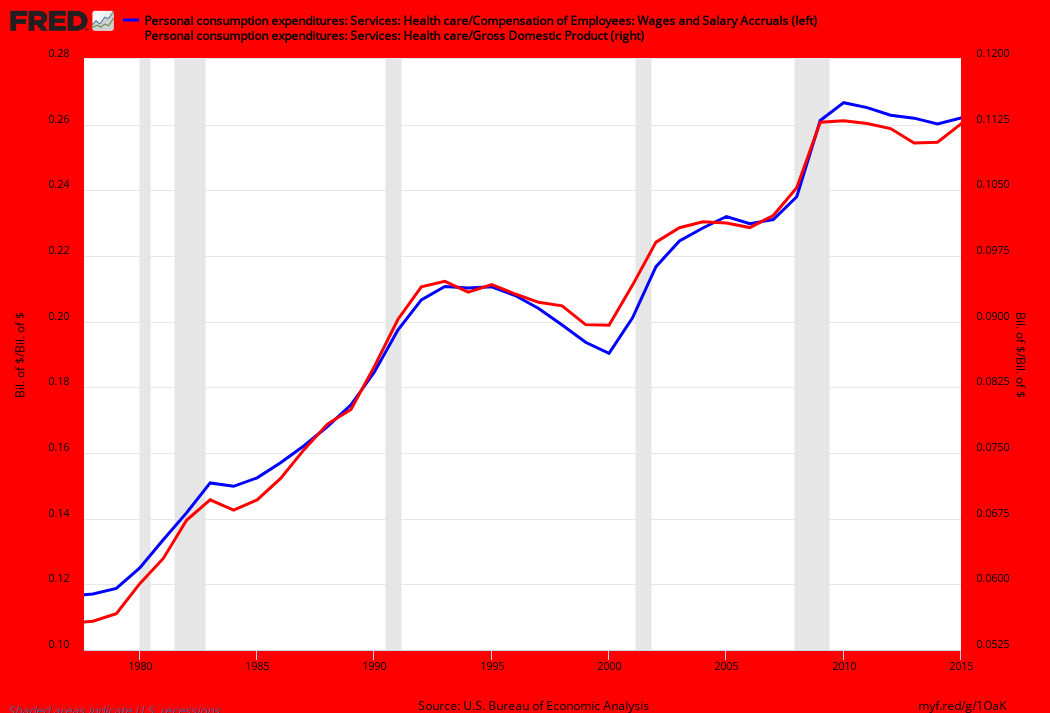
Health care spending has increased 15.8 percent under Obama, which is faster than inflation - SO MUCH FOR 'IT WON'T COST A DIME, WILL PAY FOR ITSELF, AND WILL REDUCE THE COST OF HEALTH CARE'... and The federal debt owed to the public has nearly doubled since Obama was sworn in,
increasing by 95 percent...)
You Lie! You also deleted the Facts in the chart I posted because you can't handle the truth. That is the Republican Plan. SNAP benefits skyrocketed under Bush #1 & #2. They declined under Clinton & Obama.
EMTALA signed by Reagan caused healthcare spending to skyrocket. Obamacare has reduced healthcare spending below GDP & Wage gains. As always the facts prove You Lie!!!
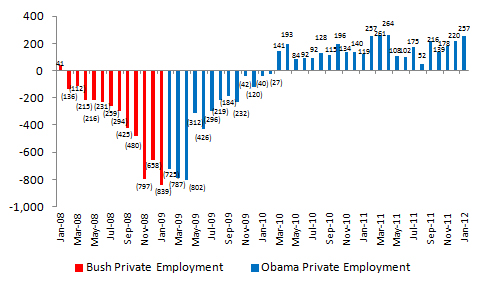
Republicans = Inflation & Job Loss!!!
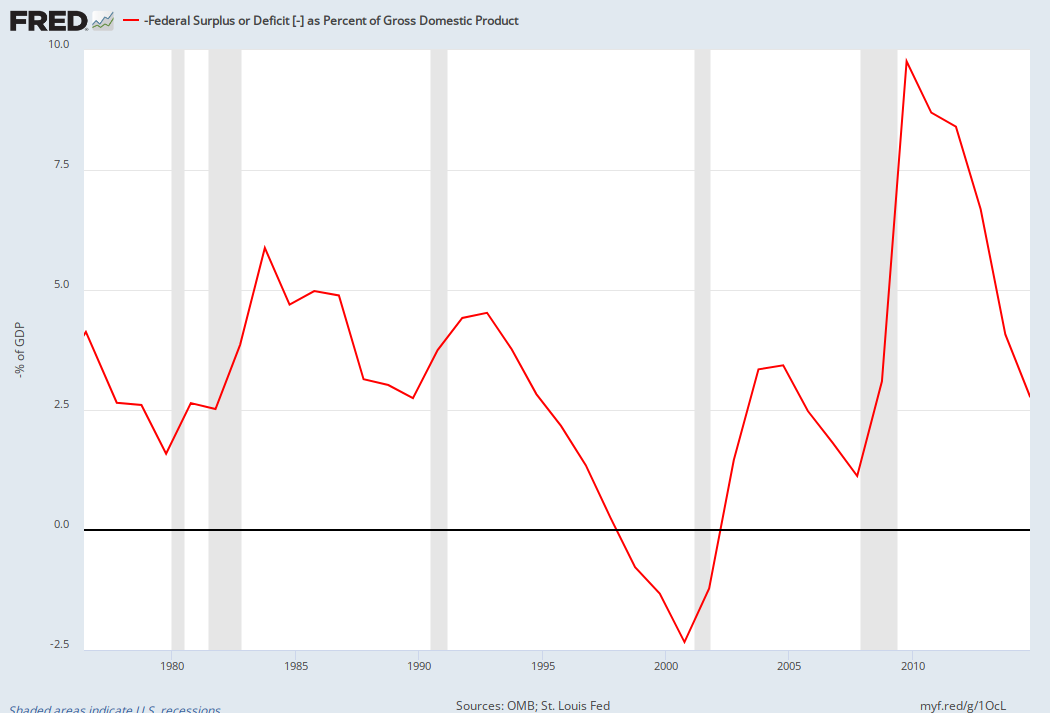
Bush Exploded Deficit! Clinton & Obama Cut Deficit!