On a neutral ENSO yet

Old Rocks

Diamond Member
Oct 31, 2008
63,085
9,749
2,040
Portland, Ore.
We are in a neutral ENSO, and this is the second or third largest anomaly of all;

UAH_LT_1979_thru_February_2020_v6.jpg
 
We are in a neutral ENSO, and this is the second or third largest anomaly of all;

UAH_LT_1979_thru_February_2020_v6.jpg

Don't know man.. It's a political year.. Maybe it's all that hot air... Enso isn't the ONLY cyclical temperature of the climate...

Did ya look at WHICH REGION is responsible for this??? He gives all the breakdowns.

The Earth has more than one Climate zone ya know..
 
I looked at the breakdown on regions.. THis increase is CERTAINLY NOT "global"... NH hemi was up about 30% in just THAT MONTH.. While the US48 states were DOWN by almost 1/2... And even "burning up" Australia had THEIR ANOMALY TANK by half...

That's a crazy distribution for the anomaly to assume.. SO -- maybe those Arctic oscillations got STUCK over just the USA for that month..

A MONTH is not climate.. We'll see...
 
Kinda interesting tho... If you look at the sat data by REGION, the ARCTIC is now at the LOWEST of the past year.. IN FACT, the anomaly for Arctic is ZERO in Feb 2020.... Compared to 5 or 6 past months at around a 1DegC anomaly.

So innocently, I'll suggest the Arctic and Antarctic is just HOARDING all their cold air in Feb -- and not "sharing nicely" with the rest of the globe...
:5_1_12024:
 
We are in a neutral ENSO, and this is the second or third largest anomaly of all;

UAH_LT_1979_thru_February_2020_v6.jpg

Actually .5 is on the border of a warm Neutral to minimum weak El-Nino level which it has been since October-December 2019 time frame, you seem oblivious to the well known months long temperature lag change over major ENSO changes. Warming can happen, and usually does with .5 level, thus your claim is not supportable.

LINK

No La-Nina at all since early 2018.

======

Here is what Dr. Spencer actually said about his chart, something you deliberately left out, you should always post a link to charts you post.

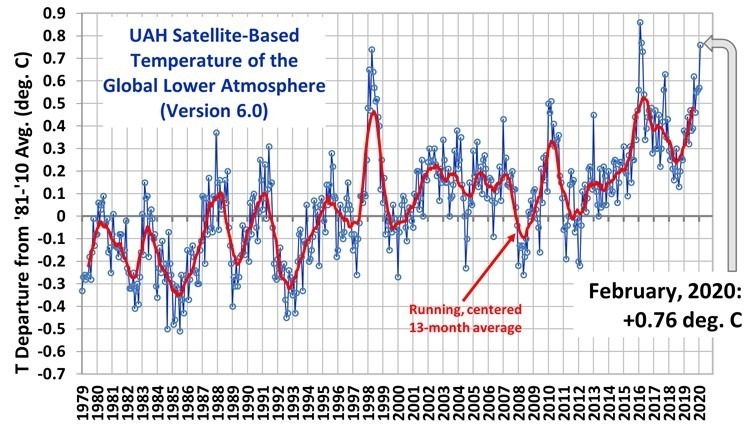
The Version 6.0 global average lower tropospheric temperature (LT) anomaly for February, 2020 was +0.76 deg. C, up considerably from the January, 2020 value of +0.57 deg. C.

This is the warmest monthly anomaly since March 2016 (+0.77 deg. C), and the warmest February since 2016 (+0.86 deg. C), both due to El Nino warmth. Continuing weak El Nino conditions are also likely responsible for the current up-tick in temperature, as I recently demonstrated here.

LINK

bolding mine
 
Last edited:
Climate Prediction Center: ENSO Diagnostic Discussion


ENSO Alert System Status: Not Active


Synopsis: ENSO-neutral is favored through Northern Hemisphere spring 2020 (~60% chance), continuing through summer 2020 (~50% chance).

During January 2020, near- to above-average sea surface temperatures (SSTs) were evident across most of the equatorial Pacific Ocean [Fig. 1]. The latest weekly Niño-3.4 and Niño-3 indices were near average (+0.2°C to 0.0°C), while the Niño-4 and Niño-1+2 indices were warmer at +1.2°C and +0.8°C, respectively [Fig. 2]. After decreasing in early to mid January, positive equatorial subsurface temperature anomalies (averaged across 180°-100°W) slightly increased during the latter part of the month [Fig. 3]. Temperatures remained above average across most of the subsurface ocean, reaching ~150m depth in the central Pacific [Fig. 4]. During the month, westerly wind anomalies persisted over the western equatorial Pacific Ocean, while upper-level winds were mostly westerly over the east-central and eastern equatorial Pacific. Tropical convection remained suppressed over Indonesia and was enhanced around the Date Line [Fig. 5]. The traditional and equatorial Southern Oscillation indices were near zero. Overall, the combined oceanic and atmospheric system remained consistent with ENSO-neutral.
 
ENSO is a dynamic feature of the Earth's atmosphere ... it's a factor we try to "average out" over many many years ... it's outside the scope of climatology ...
 

STILL doing "climate reanalysis" frauds rather then ACTUAL current weather conditions.. No wonder you're hiding under the Old Rocks... There's 14 ways of getting temp chart now and the WORST for people living in reality is to MODEL the fuck out of ACTUAL data....
Well, Mr. Flacaltenn, nice to see you have abandoned all pretense of using science, and are have resorted to simply lying about sources. Does that pay well?

What sources am I lying about? What's the purpose of "temperature Reanalysis"??? I can see a purpose for data sets that are weak or sparsely populated, but there are 10,000 temperature stations and a fleet of SATELLITES covering the globe quite well thank-you...

I think its YOU actually who doesn't understand the sourcing..

And AS a scientist, I believe pseudo color plots are GRAVELY misused with the public in attempts to "colorize" data that LOOKS more doomy than it actually is...
 
And AS a scientist, I believe pseudo color plots are GRAVELY misused with the public in attempts to "colorize" data that LOOKS more doomy than it actually is...

Naked ladies are trouble ... no argument there ... but don't you think doomy is a bit harsh? ...

No more doomy than 12 feet of sea level rise by 2100.. Or -- 16 year old troubled teens winning person of the year for having meltdowns on GW at the UN...

full disclosure. I think I made the word up... LOL...
 
Climate Reanalyzer

Climate Reanalyzer is a platform for visualizing climate and weather datasets. The site is coded and maintained by Dr. Sean Birkel through support from the Climate Change Institute at the University of Maine, the National Science Foundation, and the Russell Grinnell Memorial Trust.

Here, you can access climate information using interfaces for reanalysis and historical station data. Maps, timeseries, and correlation analyses can be plotted for gridded models. Station data and model timeseries can be exported in CSV format for use in spreadsheet software.

Climate is average weather, and so Climate Reanalyzer also provides access to weather forecast models. Get a 10-day forecast timeseries for your location by using the placename search at the top-right of every page. Forecast maps from global and regional models are also available. These maps can be animated.
 

Forum List

Back
Top