For example, the reality is CO2 is missing. We know how much additional CO2 is added from fossil fuel consumption. But apparently volcanism that we normally associate with additional CO2 release, is also absorbing huge amounts of CO2 from the silicates turning into carbonates. So the models are being tweaked to account for that.
That is questionable as well. The published, peer reviewed literature calls into question whether we are having any real effect on the atmospheric CO2 content at all. The fact is that we don't produce enough CO2 to even overcome the year to year variation in the earth's own CO2 making machinery.
Here, have a look at some of the published literature on the topic.
For example, termites alone produce two times as much CO2 as we make...the soil produces 9 times more CO2 than we do and as the earth greens, the soil area is expanding producing even more CO2... Just considering those two sources which produce eleven times more CO2 than we do, it is clear that the claim that our relative wisp of CO2 is causing the globe to warm is pseudoscience of the foulest sort.
Here...have a look at the actual scientific literature rather than believe a "hollywood" scientist who is little more than a paid whore for the climate industry. His story doesn't jibe with the peer reviewed published literature on the topic..
https://www.researchgate.net/public...SPHERIC_CO2_TO_ANTHROPOGENIC_EMISSIONS_A_NOTE
“
A necessary condition for the theory of anthropogenic global warming isthat there should be a close correlation between annual fluctuations of atmospheric CO2 and the annual rate of anthropogenic CO2 emissions.Data on atmospheric CO2 and anthropogenic emissions provided by the Mauna Loa measuring station and the CDIAC in the period
1959-2011 were studied using detrended correlation analysis to determine whether, net of their common long term upward trends, the rate of change in atmospheric CO2 is responsive to the rate of anthropogenic emissions in a shorter time scale from year to year. … R
esults do not indicate a measurable year to year effect of annual anthropogenicemissions on the annual rate of CO2 accumulation in the atmosphere.”
https://www2.meteo.uni-bonn.de/bibliothek/Flohn_Publikationen/K287-K320_1981-1985/K299.pdf
“The recent increase of the CO2-content of air varies distinctly from year to year, rather independent from the irregular annual increase of global CO2-production from fossil fuel and cement, which has since 1973 decreased from about 4.5 percent to 2.25 percent per year (Rotty 1981).”
“Comparative investigations (Keeling and Bacastow 1977, Newll et al. 1978, Angell 1981) found a positive correlation between the rate of increase of atmospheric CO2 and the fluctuations of sea surface temperature (SST) in the equatorial Pacific, which are caused by rather abrupt changes between upwelling cool water and downwelling warm water (“El Niño”) in the eastern equatorial Pacific. Indeed the cool upwelling water is not only rich in (anorganic) CO2 but also in nutrients and organisms. (algae) which consume much atmospheric CO2 in organic form, thus reducing the increase in atmospehreic CO2. Conversely the warm water of tropical oceans, with SST near 27°C, is barren, thus leading to a reduction of CO2 uptake by the ocean and greater increase of the CO2. … A crude estimate of these differences is demonstrated by the fact that
during the period 1958-1974, the average CO2-increase within five selective years with prevailing cool water only 0.57 ppm/a [per year], while during five years with prevailing warm water it was 1.11 ppm/a. Thus in a a warm water year, more than one Gt (1015 g) carbon is additionally injected into the atmosphere, in comparison to a cold water year.”
https://www.researchgate.net/public...spheric_carbon_dioxide_and_global_temperature
Conclusion:
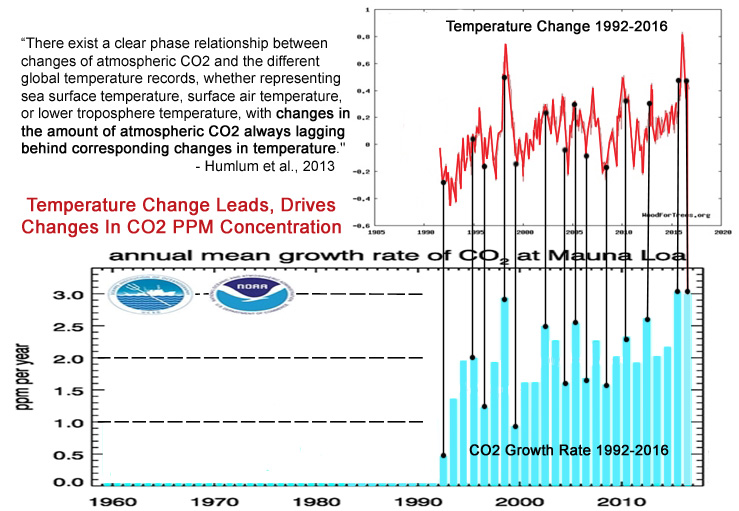
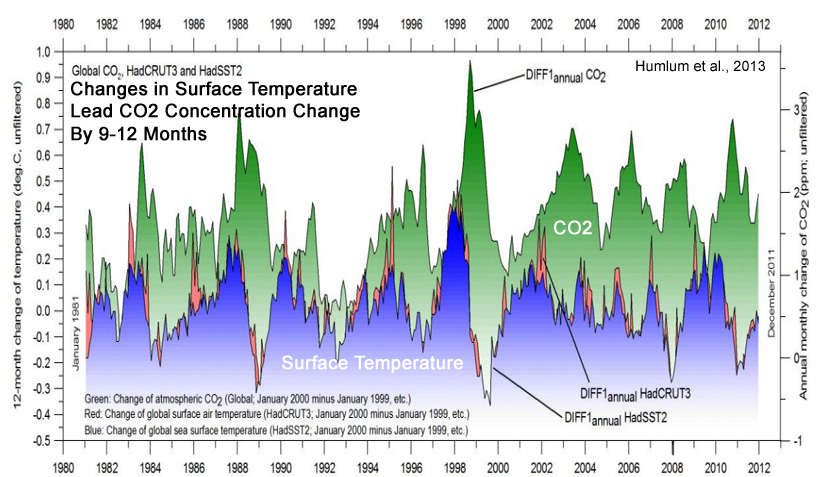
“There exist a clear phase relationship between changes of atmospheric CO2 and the different global temperature records, whetherrepresenting sea surface temperature, surface air temperature, or lower troposphere temperature, with
changes in the amount of atmospheric CO2 always lagging behind corresponding changes in temperature.”
(1) The overall global temperature change sequence of events appears to be from 1) the ocean surface to 2) the land surface to 3) the lower troposphere.
(2) Changes in global atmospheric CO2 are lagging about 11–12 months behind changes in global sea surface temperature.
(3) Changes in global atmospheric CO2 are lagging 9.5–10 months behind changes in global air surface temperature.
(4) Changes in global atmospheric CO2 are lagging about 9 months behind changes in global lower troposphere temperature.
(5) Changes in ocean temperatures appear to explain a substantial part of the observed changes in atmospheric CO2 since January 1980.
(6) CO2 released from anthropogenic sources apparently has little influence on the observed changes in atmospheric CO2, and changes in atmospheric CO2 are not tracking changes in human emissions.
(7) On the time scale investigated, the overriding effect of large volcanic eruptions appears to be a reduction of atmospheric CO2, presumably due to the dominance of associated cooling effects from clouds associated with volcanic gases/aerosols and volcanic debris.
(8) Since at least 1980 changes in global temperature, and presumably especially southern ocean temperature, appear to represent a major control on changes in atmospheric CO2.
SAGE Journals: Your gateway to world-class journal research
“The warming and cooling of the ocean waters control how much CO2 is exchanged with atmosphere and thereby controlling the concentration of atmospheric CO2.
It is obvious that when the oceans are cooled, in this case due to volcanic eruptions or La Niña events, they release less CO2 and when it was an extremely warm year, due to an El Niño, the oceans release more CO2. [D]uring the measured time 1979 to 2006 there has been a continued natural increase in temperature causing a continued increase of CO2 released into the atmosphere. This implies that
temperature variations caused by El Niños, La Niñas, volcanic eruptions, varying cloud formations and ultimately the varying solar irradiation control the amount of CO2 which is leaving or being absorbed by the oceans.”
https://pubs.acs.org/doi/abs/10.1021/ef800581r
“With the short (5−15 year) RT residence time results shown to be in quasi-equilibrium, this then
supports the (independently based) conclusion that the long-term (∼100 year) rising atmospheric CO2 concentration is not from anthropogenic sources but, in accordance with conclusions from other studies, is most likely the outcome of the rising atmospheric temperature, which is due to other natural factors. This further supports the conclusion that global warming is not anthropogenically driven as an outcome of combustion.”
https://iopscience.iop.org/article/10.1088/1748-9326/8/1/011006/meta
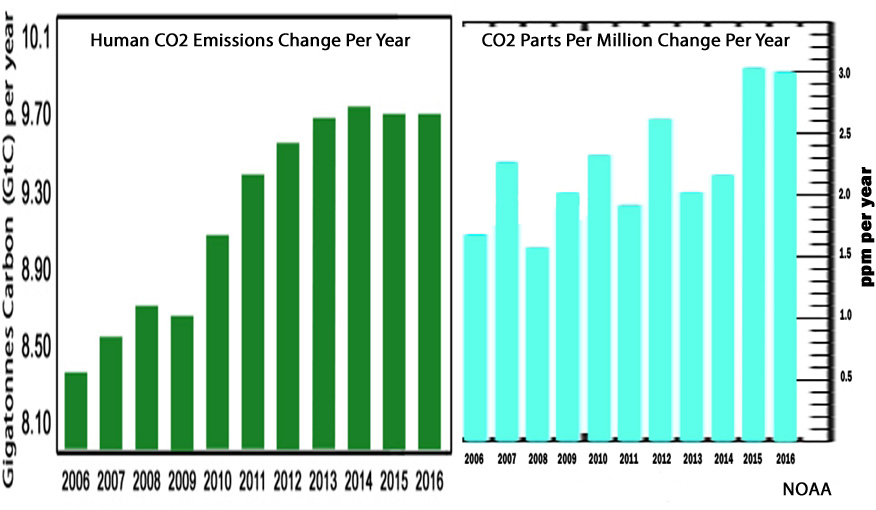
“However, it is the dependence of the airborne fraction on fossil fuel emission rate that makes the post-2000 downturn of the airborne fraction particularly striking.
The change of emission rate in 2000 from 1.5% yr-1 [1960-2000]
to 3.1% yr-1 [2000-2011]
, other things being equal, would [should] have caused a sharp increase of the airborne fraction”
Error - Cookies Turned Off
“
[T]he trend in the airborne fraction [ratio of CO2 accumulating in the atmosphere to the CO2 flux into the atmosphere due to human activity]
since 1850 has been 0.7 ± 1.4% per decade, i.e. close to and not significantly different from zero. The analysis further shows that the statistical model of a constant airborne fraction agrees best with the available data if emissions from land use change are scaled down to 82% or less of their original estimates.
Despite the predictions of coupled climate-carbon cycle models, no trend in the airborne fraction can be found.”
There is plenty more actual evidence that our effect on the atmospheric CO2 concentration is negligible...how much more would you like to see?