SunsetTommy is just like ChemEngineer and Chem's Denialism on Climate AND EVOLUT!ON, in that they BOTH put everyone who beats them in every debate on IGNORE.
I Beat the hell out of BOTH and they have HAD to resort to Ignore to keep posting.
Chem had over 35 Posters on IGNORE at one point in ONE science section. He was Denying Evo and was getting buried.
He, Like Sunset is really a Selecta-Quote-Miner, using outdated an Misleading quotes/graphs/etc.
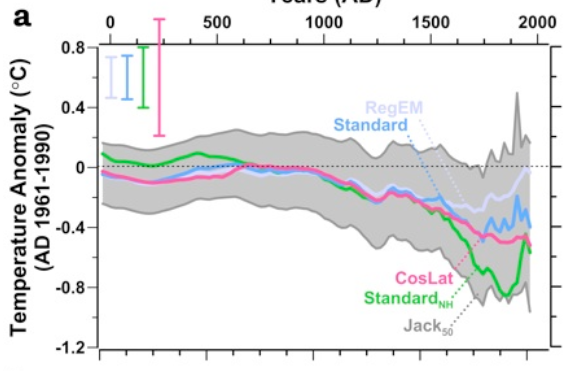
How about Marcott 2021 ? (not 2013, NOT pre 2009 decades)
- NATURE PODCAST
- 10 November 2021 Nature
Climate special: the past and future of the Earth's climate
Reassessing 24,000 years of global temperatures, and on the ground at COP26.
[......]
Interviewee: Shaun Marcott
"..The past record provides perspective. Papers like this basically point out, just at the very basic level, what has happened before and where we are in that context and where we’re heading towards. In a Prior paper that we had, we said statistically we don’t really know if today is any warmer than what we call the warm period of the last 10,000 years.
This paper has said actually, We’ve Left what was Normal.
That’s an important perspective to have when you think about where we’re off to, considering these Temperatures that we’re Trajecting towards, as far we know, we Haven’t seen in 50 Million years or so, and the world was a lot Different then.""..""
[......]
Nature
- - - -
Sunset Tommy cannot even debate Climate!
He Dumps an article from somewhere (like WTFUWT) and says: ""You must refute this paper or you lose.""
He himself is NOT EVEN CONVERSANT on the topic, and unlike me cannot lay out his position AND/OR why.
He put me on IGNORE after my SIX attempts to make him explain his position on warming and whether and if it was even warming at all.
He could Not!!
He prefers the motor mouth Crick who Unlike me doesn't Crush him with 100%/180° Rebuttal as I just did above AGAIN using his own source: Marcott.
(He Fallaciously/ posted COLD WEATHER DAYS in Skooker's anti-Science "Skeptics Winning" thread as if it was Not warming, but in fact cooling.)
So here Again: ANOTHER SUNSET for TOMMY.
NOTE Demented Westwall's NO CONTENT TROLL Below.
He can't post more than one line even off topic.
`