Of course the voter rolls were not up to date. Dead people and voters that moved did have ballots cast for them in the election.
He didn't claim that voter rolls were changed by the county precinct officials. He claimed that the voter databases were hacked and manipulated (before the election) to add fabricated phantom voters that did not exist so that during the election, if the results were not going the way the hackers wanted, they could add the phantom ballots to the tally (without actually scanning a real ballot) to maintain the lead in favor of their desired winner. They just had to be careful not to add so many as to exceed the number of age-eligible voters in the precinct they were hacking. That may explain their use of census data. If extra votes were not needed, they were not used.
Not so. In the 2020 election, this only had to occur in the swing states. You know, the ones that all stopped counting in the middle of the night because Trump was getting so many votes he was overwhelming their fraud system. That's when vote counts were actually taken from Trump and given to Biden. That's when a massive dump of votes occurred in one precinct where there were not enough scanning machines to have actually processed as many votes as were dumped in for Biden.
A Quantitative Analysis of Decisive Vote Updates in Michigan, Wisconsin, and Georgia on and after Election Night

votepatternanalysis.substack.com
Executive Summary
In the early hours of November 4th, 2020, Democratic candidate Joe Biden received several major “vote spikes” that substantially — and decisively — improved his electoral position in Michigan, Wisconsin, and Georgia. Much skepticism and uncertainty surrounds these “vote spikes.” Critics point to suspicious vote counting practices, extreme differences between the two major candidates’ vote counts, and the timing of the vote updates, among other factors, to cast doubt on the legitimacy of some of these spikes. While data analysis cannot on its own demonstrate fraud or systemic issues, it can point us to statistically anomalous cases that invite further scrutiny.
This is one such case: Our analysis finds that a few key vote updates in competitive states were unusually large in size and had an unusually high Biden-to-Trump ratio. We demonstrate the results differ enough from expected results to be cause for concern.
With this report, we rely only on publicly available data from the New York Times to identify and analyze statistical anomalies in key states. Looking at 8,954 individual vote updates (differences in vote totals for each candidate between successive changes to the running vote totals, colloquially also referred to as “dumps” or “batches”), we discover a remarkably consistent mathematical property: there is a clear inverse relationship between difference in candidates’ vote counts and and the ratio of the vote counts. (In other words, it's not surprising to see vote updates with large margins, and it's not surprising to see vote updates with very large ratios of support between the candidates, but it
is surprising to see vote updates which are both).
The significance of this property will be further explained in later sections of this report. Nearly every vote update, across states of all sizes and political leanings follow this statistical pattern. A very small number, however, are especially aberrant. Of the seven vote updates which follow the pattern the least, four individual vote updates — two in Michigan, one in Wisconsin, and one in Georgia — were particularly anomalous and influential with respect to this property and
all occurred within the same five hour window.
In particular, we are able to quantify the extent of compliance with this property and discover that,
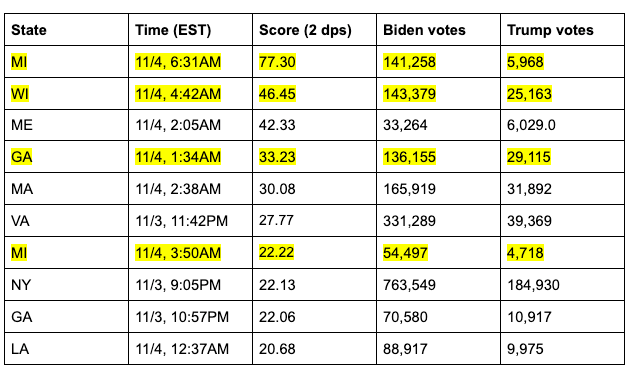
of the 8,954 vote updates used in the analysis, these four decisive updates were the 1st, 2nd, 4th, and 7th most anomalous updates in the entire data set. Not only does each of these vote updates not follow the generally observed pattern, but the anomalous behavior of these updates is particularly extreme. That is, these vote updates are outliers of the outliers.
The four vote updates in question are:
- An update in Michigan listed as of 6:31AM Eastern Time on November 4th, 2020, which shows 141,258 votes for Joe Biden and 5,968 votes for Donald Trump
- An update in Wisconsin listed as 3:42AM Central Time on November 4th, 2020, which shows 143,379 votes for Joe Biden and 25,163 votes for Donald Trump
- A vote update in Georgia listed at 1:34AM Eastern Time on November 4th, 2020, which shows 136,155 votes for Joe Biden and 29,115 votes for Donald Trump
- An update in Michigan listed as of 3:50AM Eastern Time on November 4th, 2020, which shows 54,497 votes for Joe Biden and 4,718 votes for Donald Trump
This report predicts what these vote updates would have looked like, had they followed the same pattern as the vast majority of the 8,950 others. We find that the extents of the respective anomalies here are
more than the margin of victory in all three states — Michigan, Wisconsin, and Georgia — which collectively represent forty-two electoral votes.
Extensive mathematical detail is provided and the data and the code (for the data-curation, data transformation, plotting, and modeling) are all attached in the
appendix to this document[1].
Background
Late on Election Night 2020, President Donald J. Trump had a lead of around 100,000 votes in Wisconsin, a lead of around 300,000 votes in Michigan, and a lead of around 700,000 votes in Pennsylvania. Back-of-the-envelope calculations showed that in order to overtake President Trump, Joe Biden would have to substantially improve his performance in the remaining precincts — many of which were in heavily blue areas like Detroit, Milwaukee, and Philadelphia.
On Election Night, conflicting news reports came in that various precincts were stopping their count for the evening, sending election officials home, or re-starting their counts. There remains a large amount of confusion to this day about the extent to which various precincts stopped counting, as well as the extent to which any state election laws or rules were broken by sending election officials home prematurely. Whatever the case is, various precincts in Wisconsin, Michigan, and Pennsylvania continued to report numbers throughout the night.
By the early hours of the following morning, Wisconsin had flipped blue, as did Michigan soon after. A few days later, Georgia and Pennsylvania followed suit. Given the uncertain context, many American observers and commentators were immediately uncomfortable or skeptical of these trends.
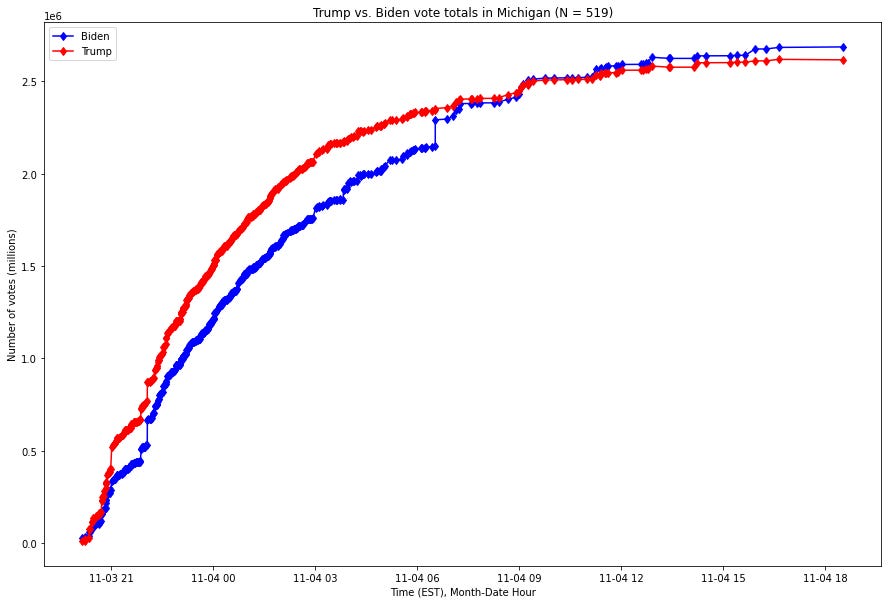
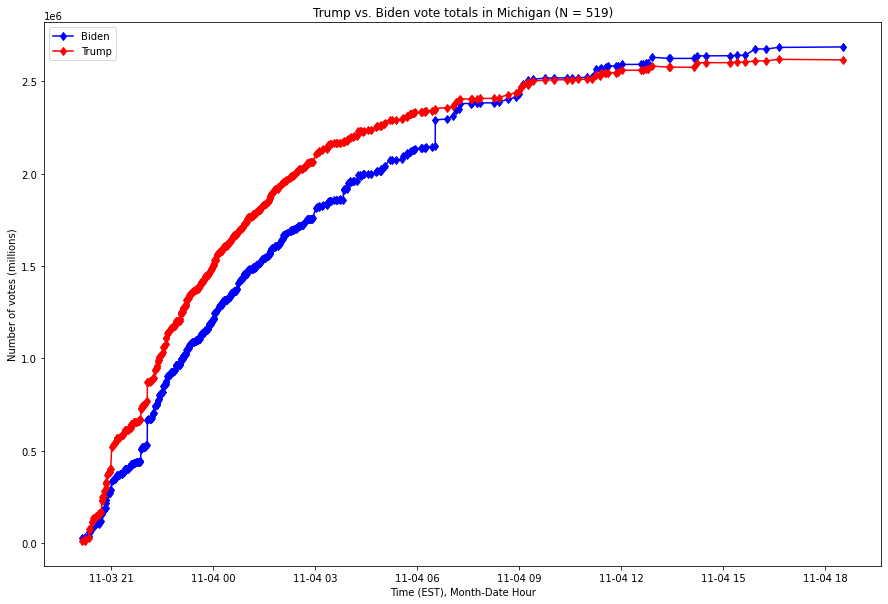
For context, using publicly available data from the New York Times, here is a visualization of the number of votes by candidate in Michigan from the beginning of election night to 7pm Eastern Standard Time (EST) on November 4th, 2020:

Fig. 1. X-axis is the Month-Year Hour of the time, Y-axis is the number of votes as of that time, expressed in millions of votes. The red series is the running number of votes for Donald Trump, and the blue series the running number of votes for Joe Biden.
As this graph shows, Joe Biden overtook President Trump’s lead through a small number of vote updates which broke overwhelmingly for Biden in Michigan in the early hours of the morning of November 4th.
The situation in Wisconsin is even more stark: a single update to the vote count brought Biden from trailing by over 100,000 votes into the lead. Here is the comparable graph, over the same time range, for Wisconsin, with the x-axis (time) expressed in Central Standard Time (CST):
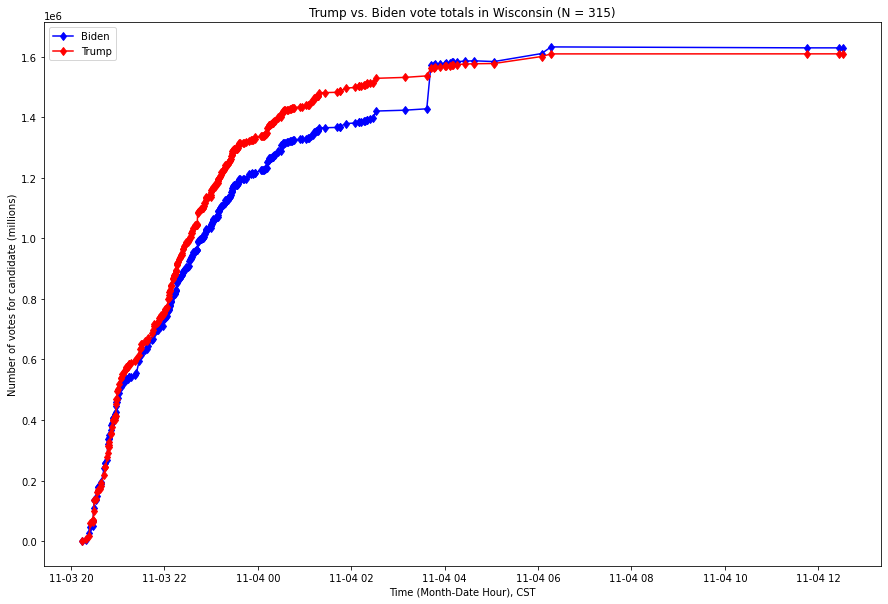
Fig. 2. X-axis is the Month-Year Hour of the time, Y-axis is the number of votes as of that time, expressed in millions of votes. The red series is the running number of votes for Donald Trump, and the blue series the running number of votes for Joe Biden.
Various versions of these graphs spurred online discourse. While some commentators provided relatively partisan analysis, others merely expressed surprise at the near-vertical leaps in some of these vote updates. Is it likely this phenomenon would arise organically? In an attempt to address this question, this report assesses how extreme and unusual these spikes are with respect to both other vote updates in the states of Michigan, Wisconsin, and Georgia, as well as those around the nation.
Through several investigative mechanisms, we find these four vote updates to be extraordinarily anomalous. While these alone do not prove the existence of fraud or systemic issue, it invites further scrutiny.
(clip)
Quantifying the Extremity
Having demonstrated visually how anomalous the four key vote updates are, we can now proceed to attempt to quantify how unusual it is that these three points exist at once and that two of them are from the same state.
The below graph has two particularly interesting visual properties:
- The graph is presented two-dimensionally, but it’s really three-dimensional. It’s visibly much denser in the center, has what appear to be something like two normal distributions, and as you move farther from the origin along a positive-sloping line which runs through the origin, the lower the density you can expect.
- The outer “edges” of the graph, in the top-right and bottom-left quadrants, closely resemble the shape of the line y = 1 / x.
We similarly expect points to be in both the top-right and bottom-left quadrants, and between an outer line which has the shape of y = 1 / x and the origin. Since these values will thus mostly be either both negative or both positive, we can see that multiplying each point’s x-coordinate with its y-coordinate is a useful way of assessing the extent to which it follows this sort of distribution. Since there are more points near the origin than there are on the visible “boundary lines” (i.e. the sequences of points on the outer edges in the first and third quadrants which visibly form these lines which look like a graph, if perhaps scaled, of y = 1/x).
We thus, for each (again, both standardized by state) coordinate pair of Biden-Trump margin and the log-ratio of Biden to Trump votes, can
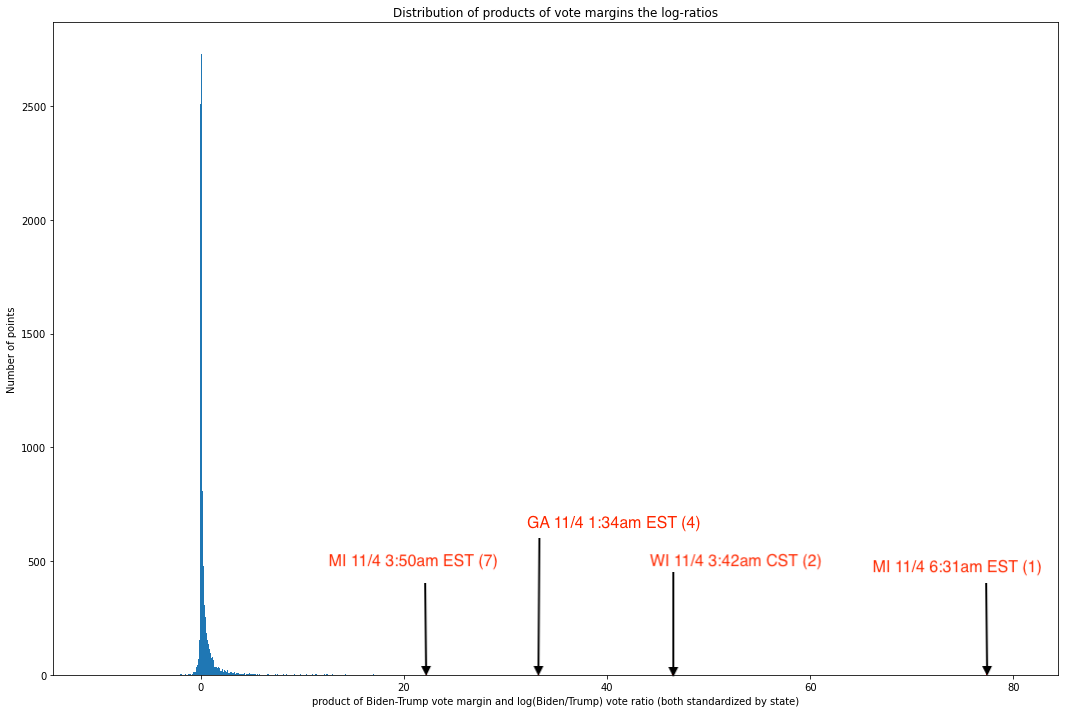
multiply these values and examine the distribution of the resulting products. Here, the larger a value is in magnitude, the less it follows the non-co-extremity. Plotting these products gives us:

Fig. 11. Histogram of products of x and y values for each coordinate pair in Fig. 10
As we can see, the values are
overwhelmingly concentrated near the median, and the graph is profoundly right-skewed — otherwise, the x-axis would not need to stretch all the way to 80. All but 60 out of 8,954 unique updates have values less than 10, and all but 10 have values less than 20. In other words, an overwhelming share of updates seem to track this rule pretty closely, but a small number of updates are truly extreme outliers.
A quick dive into these ten points reveals data which, by this point in the report, will be very familiar to the reader:
As we can see, four of the seven most anomalous vote updates — which is to say, updates in which the margin and ratio are co-extreme — are in election-critical states and occurred during the same five hour period where the circumstances on the ground were (and remain) contested and highly suspicious.
It is worth noting here that roughly 15% of the vote updates in the data set of 8,954 were from these three states. If we assumed it equally likely that any particular state should end up at any of these extreme points, there would be about a 1.2% chance that three states are represented in three out of the top four or four out of the top seven spots, and about a 0.99% chance that these three states would occupy five out of the top seven spots. It is thus very surprising to see the states in question be so disproportionately represented in the top 0.11% of the distribution of co-extremity[17].
(clip)
Conclusion
This report studies 8,954 individual updates to the vote totals in all 50 states and finds that four individual updates — two of which were widely noticed on the internet, including by the President — are profoundly anomalous; they deviate from a pattern which is otherwise found in the vast majority of the remaining 8,950 vote updates. The findings presented by this report [28]suggest that four vote count updates — which collectively were decisive in Michigan, Wisconsin, and Georgia, and thus decisive of a critical forty-two electoral votes — are especially anomalous and merit further investigation.
In particular, the finding that the broader data follows general patterns and our ability to measure just how much any individual vote update does — or doesn’t — follow this pattern allows us to make concrete claims about both how extreme any given vote update is and about what any particular vote update might have looked like, had it been less extreme one one axis or another.
We further find that if these updates were only more extreme than 99% of all updates nationally in terms of their deviation from this generally-observed pattern, that, holding all else equal, Joe Biden may very well have lost the states of Michigan, Wisconsin, and Georgia, and that he would have 42 fewer Electoral votes —
putting Biden below the number required to win the Presidency. Either way, it is indisputable that his margin of victory in these three states relies on four most anomalous vote updates identified by the metric developed in this report.
We once again note that this analysis is largely restricted to four individual vote updates out of a sample of nearly 9,000. This report by no means suggests stopping investigations in Michigan, Wisconsin, Pennsylvania, Georgia, or elsewhere; it is merely that these four key ballot updates are both profoundly anomalous with respect to a metric which removes any component of different states having different partisan leanings or a different number of voters. Furthermore, this analysis does not require that we regard the final vote totals in any of these states (or counties thereof) as suspicious,
nor, critically, does it require that we accept that the observed data
should follow any particular distribution
a priori. We merely show that the data, adjusted appropriately to remove differences in size and political leaning between states,
does follow a certain pattern, and that four key vote updates deviate profoundly from that pattern.
It is our belief that the extraordinarily anomalous nature of the studied vote updates here, combined with the staggering political implications, demands immediate and thorough investigation.
Correction: a previous version of this post calculated the probability of vote updates Georgia, Wisconsin, and Michigan constituting five of the ten most co-extreme vote updates as 0.0037%. The actual value is closer to 0.99%. The authors apologize for the error and the post has been corrected to reflect this.
(clip)