ErikViking
VIP Member
Inept species will do what inept species do.Yes, the climate changes. And, recently, it has been changing due to human GHG emissions. We have to blame the humans because they're responsible.
Follow along with the video below to see how to install our site as a web app on your home screen.

Note: This feature currently requires accessing the site using the built-in Safari browser.
Inept species will do what inept species do.Yes, the climate changes. And, recently, it has been changing due to human GHG emissions. We have to blame the humans because they're responsible.
Fatalism helps no one.Inept species will do what inept species do.
Quite true. But you needed to spot the irony in the first post you responded to.Fatalism helps no one.
Scientists come to opposite conclusions about the causes of recent climate change depending on which datasets they consider. For instance, the panels on the left lead to the conclusion that global temperature changes since the mid-19th century have been mostly due to human-caused emissions, especially carbon dioxide (CO2), i.e., the conclusion reached by the UN IPCC reports. In contrast, the panels on the right lead to the exact opposite conclusion, i.e., that the global temperature changes since the mid-19th century have been mostly due to natural cycles, chiefly long-term changes in the energy emitted by the Sun.Yes, the climate changes. And, recently, it has been changing due to human GHG emissions. We have to blame the humans because they're responsible.
Another Trolling Repeat I already busted.Scientists come to opposite conclusions about the causes of recent climate change depending on which datasets they consider. For instance, the panels on the left lead to the conclusion that global temperature changes since the mid-19th century have been mostly due to human-caused emissions, especially carbon dioxide (CO2), i.e., the conclusion reached by the UN IPCC reports. In contrast, the panels on the right lead to the exact opposite conclusion, i.e., that the global temperature changes since the mid-19th century have been mostly due to natural cycles, chiefly long-term changes in the energy emitted by the Sun.

Both sets of panels are based on published scientific data, but each uses different datasets and assumptions. On the left, it is assumed that the available temperature records are unaffected by the urban heat island problem, and so all stations are used, whether urban or rural. On the right, only rural stations are used. Meanwhile, on the left, solar output is modeled using the low variability dataset that has been chosen for the IPCC’s upcoming (in 2021/2022) 6th Assessment Reports. This implies zero contribution from natural factors to the long-term warming. On the right, solar output is modeled using a high variability dataset used by the team in charge of NASA’s ACRIM sun-monitoring satellites. This implies that most, if not all, of the long-term temperature changes are due to natural factors.
Here is the link to the full paper.
ShieldSquare Captcha
You've posted that stupid denier paper many times. (Connoly/Soon)ding said:
Scientists come to opposite conclusions about the causes of recent climate change depending on which datasets they consider. For instance, the panels on the left lead to the conclusion that global temperature changes since the mid-19th century have been mostly due to human-caused emissions, especially carbon dioxide (CO2), i.e., the conclusion reached by the UN IPCC reports. In contrast, the panels on the right lead to the exact opposite conclusion, i.e., that the global temperature changes since the mid-19th century have been mostly due to natural cycles, chiefly long-term changes in the energy emitted by the Sun.
Both sets of panels are based on published scientific data, but each uses different datasets and assumptions. On the left, it is assumed that the available temperature records are unaffected by the urban heat island problem, and so all stations are used, whether urban or rural. On the right, only rural stations are used. Meanwhile, on the left, solar output is modeled using the low variability dataset that has been chosen for the IPCC’s upcoming (in 2021/2022) 6th Assessment Reports. This implies zero contribution from natural factors to the long-term warming. On the right, solar output is modeled using a high variability dataset used by the team in charge of NASA’s ACRIM sun-monitoring satellites. This implies that most, if not all, of the long-term temperature changes are due to natural factors.
Here is the link to the full paper.
ShieldSquare Captcha
Click to expand...

there have been many reviews and articles published that reached the conclusion that much of the global warming since the mid-20th century and earlier could be explained in terms of solar variability.Another Trolling Repeat I already busted.
Ding is a Droning REPEAT TROLL with a very limited inventory he pisses up daily.
He is non-conversant on the Climate topic.
Just one line quips and repeats of maybe 6 Charts/studies.[/SIZE]
- - - - - -
You've posted that stupid denier paper many times. (Connoly/Soon)
The overwhelming majority of scientists and ALL the world's scientific orgs acknowledge AGW.
It's rather funny in that:
Some observations about Connolly et al (2021) “How much has the sun influenced northern hemisphere temperature trends”
Test article Test Article The Connolly et al paper can be found at: https://iopscience.iop.
Among the many problems in the infamous POS paper/authors are:
1. It only deals with the Northern Hemisphere, Not GW. :^)
2. The Lockwood paper referenced by Connolly doesn't support what he is saying.
3. The most cited person BY FAR in the Connolly/Soon Paper is... Soon himself. 149 Times!
who is he?
Wiki:
“Willie Wei-Hock Soon
Soon is a climate change denier,[4][6] disputing the scientific understanding of climate change, and contends that most global warming is caused by solar variation rather than by human activity.[7][8] He co-wrote a paper whose methodology was widely criticised by the scientific community.[9] Climate scientists such as Gavin Schmidt of the Goddard Institute for Space Studies have Refuted Soon's arguments, and the Smithsonian does not support his conclusions. He is nonetheless frequently cited by politicians opposed to climate-change legislation.[4][6]
[.....]
From 2005 to 2015, Soon had received over $1.2 million from the fossil fuel industry, while failing to disclose that conflict of interest in most of his work”
Wiki:
Opposing (The AGW Consensus)
Since 2007, when the American Association of Petroleum Geologists released a revised statement,[29] NO national or international scientific body any longer rejects the findings of human-induced effects on climate change.".."[28][30]..
Scientific consensus on climate change - Wikipedia
Little TrollTwerp Ding tried more than one line with his worn out, Refuted, and renegade paper.
Busted.
.
Yes, the climate changes. And, recently, it has been changing due to human GHG emissions. We have to blame the humans because they're responsible.

NOAA
Mid-Holocene Warm Period – About 6,000 Years Ago
""Mid-Holocene Warm Period – About 6,000 Years Ago Paleoclimatologists have long suspected that the "middle Holocene," a period roughly from 7,000 to 5,000 years ago, was warmer than the present day. Terms like the Altithermal or Hypsithermal or Climatic Optimum have all been used to refer to this warm period that marked the middle of the current interglacial period.
Today, however, we know that these terms are obsolete and that the truth of the Holocene is more complicated than originally believed. What is most remarkable about the mid-Holocene is that we now have a good understanding of both the global patterns of temperature change during that period and what caused them.
It appears clear that changes in Earth's orbit have operated slowly over thousands and millions of years to change the amount of solar radiation reaching each latitudinal band of Earth during each month. These Orbital changes can be easily calculated and predict that the Northern Hemisphere Should have been warmer than today during the mid-Holocene in the summer and colder in the winter. The combination of warmer summers and colder winters is apparent for some regions in the proxy records and model simulations. There are some important exceptions to this pattern, however, including colder summers in the monsoon regions of Africa and Asia due to stronger monsoons with associated increased cloud cover during the mid-Holocene, and warmer winters at high latitudes due to reduction of winter sea ice cover caused by more summer melting.
In summary, the mid-Holocene, roughly 6,000 years ago, was generally warmer than today during summer in the Northern Hemisphere.
In some locations, this could be true for winter as well.
Moreover, we clearly know the cause of this Natural warming, and we know without doubt that this proven "astronomical" climate forcing mechanism CANNOT be responsible for the warming over the last 100 years.
https://www.ncei.noaa.gov/sites/default/files/2021-11/12 Mid-Holocene Warm Period & Penultimate Interglacial Period & Early Eocene Period -FINAL OCT 2021.pdf
`
In summary, the mid-Holocene, roughly 6,000 years ago, was generally warmer than today during summer in the Northern Hemisphere.
And the planet survived? That's a relief.
 www.nature.com
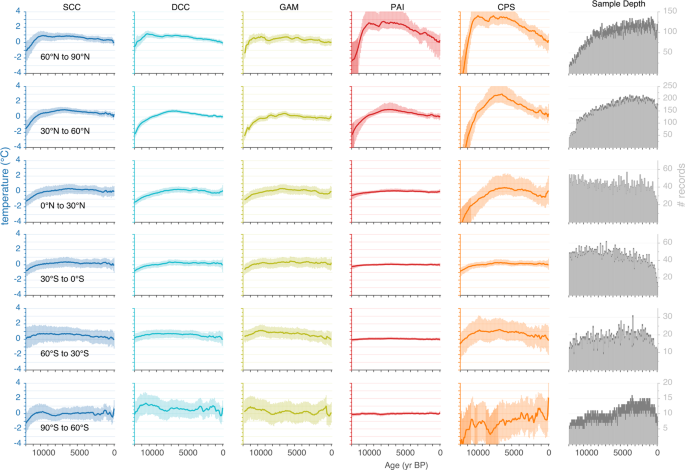
Holocene global mean surface temperature, a multi-method reconstruction approach - Scientific Data
An extensive new multi-proxy database of paleo-temperature time series (Temperature 12k) enables a more robust analysis of global mean surface temperature (GMST) and associated uncertainties than was previously available. We applied five different statistical methods to reconstruct the GMST of...
An extensive new multi-proxy database of paleo-temperature time series (Temperature 12k) enables a more robust analysis of global mean surface temperature (GMST) and associated uncertainties than was previously available. We applied five different statistical methods to reconstruct the GMST of the past 12,000 years (Holocene). Each method used different approaches to averaging the globally distributed time series and to characterizing various sources of uncertainty, including proxy temperature, chronology and methodological choices. The results were aggregated to generate a multi-method ensemble of plausible GMST and latitudinal-zone temperature reconstructions with a realistic range of uncertainties. The warmest 200-year-long interval took place around 6500 years ago when GMST was 0.7 °C (0.3, 1.8) warmer than the 19th Century (median, 5th, 95th percentiles). Following the Holocene global thermal maximum, GMST cooled at an average rate −0.08 °C per 1000 years (−0.24, −0.05). The multi-method ensembles and the code used to generate them highlight the utility of the Temperature 12k database, and they are now available for future use by studies aimed at understanding Holocene evolution of the Earth system.
This says that the warmest period in the past 12,000 years was a "200 year long interval" that was 0.3C - 1.8C warmer than the median temperature of the 19th century. That is NOT warmer than "today".
I've asked before, where has climate changed in your lifetime?Yes, the climate changes. And, recently, it has been changing due to human GHG emissions. We have to blame the humans because they're responsible.
Earth.I've asked before, where has climate changed in your lifetime?
Where on earth? Funny, you never answer.I've asked before, where has climate changed in your lifetime?
Earth.
And yet the planet is cooler than past interglacial cycles.Holocene global mean surface temperature, a multi-method reconstruction approach - Scientific Data
An extensive new multi-proxy database of paleo-temperature time series (Temperature 12k) enables a more robust analysis of global mean surface temperature (GMST) and associated uncertainties than was previously available. We applied five different statistical methods to reconstruct the GMST of...
An extensive new multi-proxy database of paleo-temperature time series (Temperature 12k) enables a more robust analysis of global mean surface temperature (GMST) and associated uncertainties than was previously available. We applied five different statistical methods to reconstruct the GMST of the past 12,000 years (Holocene). Each method used different approaches to averaging the globally distributed time series and to characterizing various sources of uncertainty, including proxy temperature, chronology and methodological choices. The results were aggregated to generate a multi-method ensemble of plausible GMST and latitudinal-zone temperature reconstructions with a realistic range of uncertainties. The warmest 200-year-long interval took place around 6500 years ago when GMST was 0.7 °C (0.3, 1.8) warmer than the 19th Century (median, 5th, 95th percentiles). Following the Holocene global thermal maximum, GMST cooled at an average rate −0.08 °C per 1000 years (−0.24, −0.05). The multi-method ensembles and the code used to generate them highlight the utility of the Temperature 12k database, and they are now available for future use by studies aimed at understanding Holocene evolution of the Earth system.
This says that the warmest period in the past 12,000 years was a "200 year long interval" that was 0.3C - 1.8C warmer than the median temperature of the 19th century. That is NOT warmer than "today".
In even the shortest of long runs, climate is a global characteristic. And what is this "you never answer" bullshit? I have never been asked this question before and I am answering it. Waiting two-and-a-half hours at dinnertime and then claiming I'm unresponsive is pretty fucked up.Where on earth? Funny, you never answer.