Globull Warming Gloom and Doom – 1922?

longknife

Diamond Member
Sep 21, 2012
42,221
13,090
2,250
Sin City
The Arctic Ocean is warming up, icebergs are growing scarcer and in some places the seals are finding the water too hot,” said the Washington Post on November 2, 1922, citing a report to the Commerce Department received from Bergen, Norway. This report was based on statements by fishermen, seal hunters, and explorers; “soundings to a depth of 3,100 meters showed the gulf stream still very warm.” Additionally, the report said that “scarcely any ice has been met as far north as 81 degrees 29 minutes.” As a logical thinker, if this were true, I would have definitely considered the Gulf Stream a possible cause of the alleged warming, not the greenhouse gases, or the currently maligned CO2

Read the rest of this @ Liberal Doom and Gloom 90 Years Ago to see that Algored and his crew aren't crying anything new!
 
((The reference to the Time Mag Cover in 1977 with a penguin is a "fraud".. However -- Time Mag ran 4 or 5 articles in the 1970s about Global Cooling.. ))

That unpleasantness aside... .

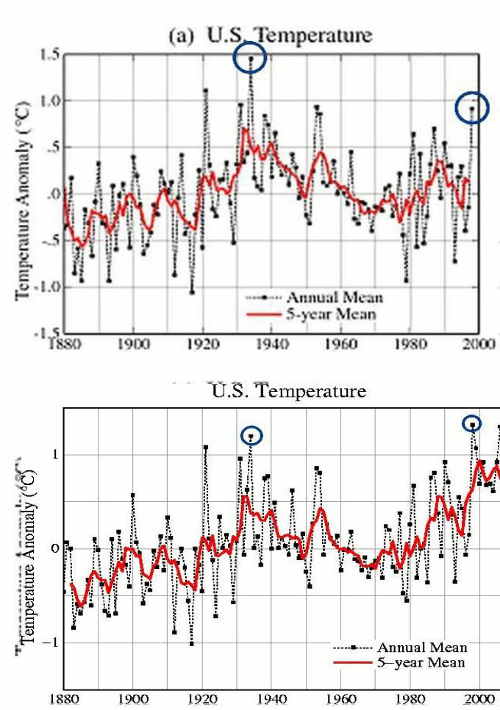
The temperature cooking that's been goin at NASA GISS is aimed at REDUCING the temperatures in the historical record of the 1930s and 1940s so that todays' numbers seem more impressive..

Plenty of examples of how the 1930 temps STILL CHANGE year to year and decade to decade.

index.php


1998changesannotated.gif


The top animation is the GLOBAL diff over just ONE YEAR...

The bottom one is the USA diff between the historical record in 1999 and in 2006..

Who says you can't rewrite history every day???
 
Last edited:
Instead of depending on denialist cherrypicking and whackaloon conspiracy theories about forged data, why not just look at the sea ice data for 1922? That data exists, you know. But no denialist will use it, because it's good data. Given the choice between good data and a cherrypicked deflection, the denialist always takes the deflection, because the good data always destroys their fables.

This shows the Arctic sea ice plots from the Danish Meteorological Institute, August, 1922 to 1939, then adds 2012 to the last frame. Notice how 2012, is way, way below all the others. According to denialists, this somehow means 2012 had more ice. Why? Because their vague cherrypick said so, and thus the good data can be discarded.

1920-1939.gif
 
Last edited:
Mammoth, you know I disagree with the Globull Warming theory but thanks for the great graphics.
 

Forum List

Back
Top