Muhammed
Diamond Member
and how much of the globe has temperature stations?
The Earth is a big place. The U.S. only covers less than 2% of the Earth's surface. Globally, 2014 was the hottest year on record at that time, although that record was broken again, by an even larger margin in 2015, and will very likely be broken yet again in 2016.
Looking at just one year in just the USA does not reflect the global picture. A longer time frame is essential to understanding the trend.
In the USA, 2012 was the hottest year on record by a large margin, and the ratio of record highs to record lows mirrored that. 2016 may wind up as the next new hottest year on record in the USA.

The interactive above shows the top 10 states with the biggest difference between the number of high-temperature and low-temperature records under the Ratio to Low tab at the top. Ohio has thus far seen 49 high-temperature records set for every one low-temperature record. Maryland and Wisconsin have both seen about 41 record highs for every one record low. All of the states in the top 10 have seen more than 20 record highs for every record low, and there hasn’t been a single state that has seen more low-temperature records than highs (or even a 1:1 ratio). Of note is Rhode Island, where there has not been a single low-temperature record set yet in 2012.
2013 and 2014 were a bit cooler in the U.S., but in 2015 he ratio of record highs to record lows has once again shifted to more record highs than record lows.
Record Highs vs. Record Lows
ClimateCentral
Aug 19th, 2015
This year is on pace to be the hottest on record globally, coming off a record hot year in 2014. Looking closer to home, parts of the western U.S. are also in the midst of one of their hottest years on record so far. Another important set of records are the daily records set at stations across the country.
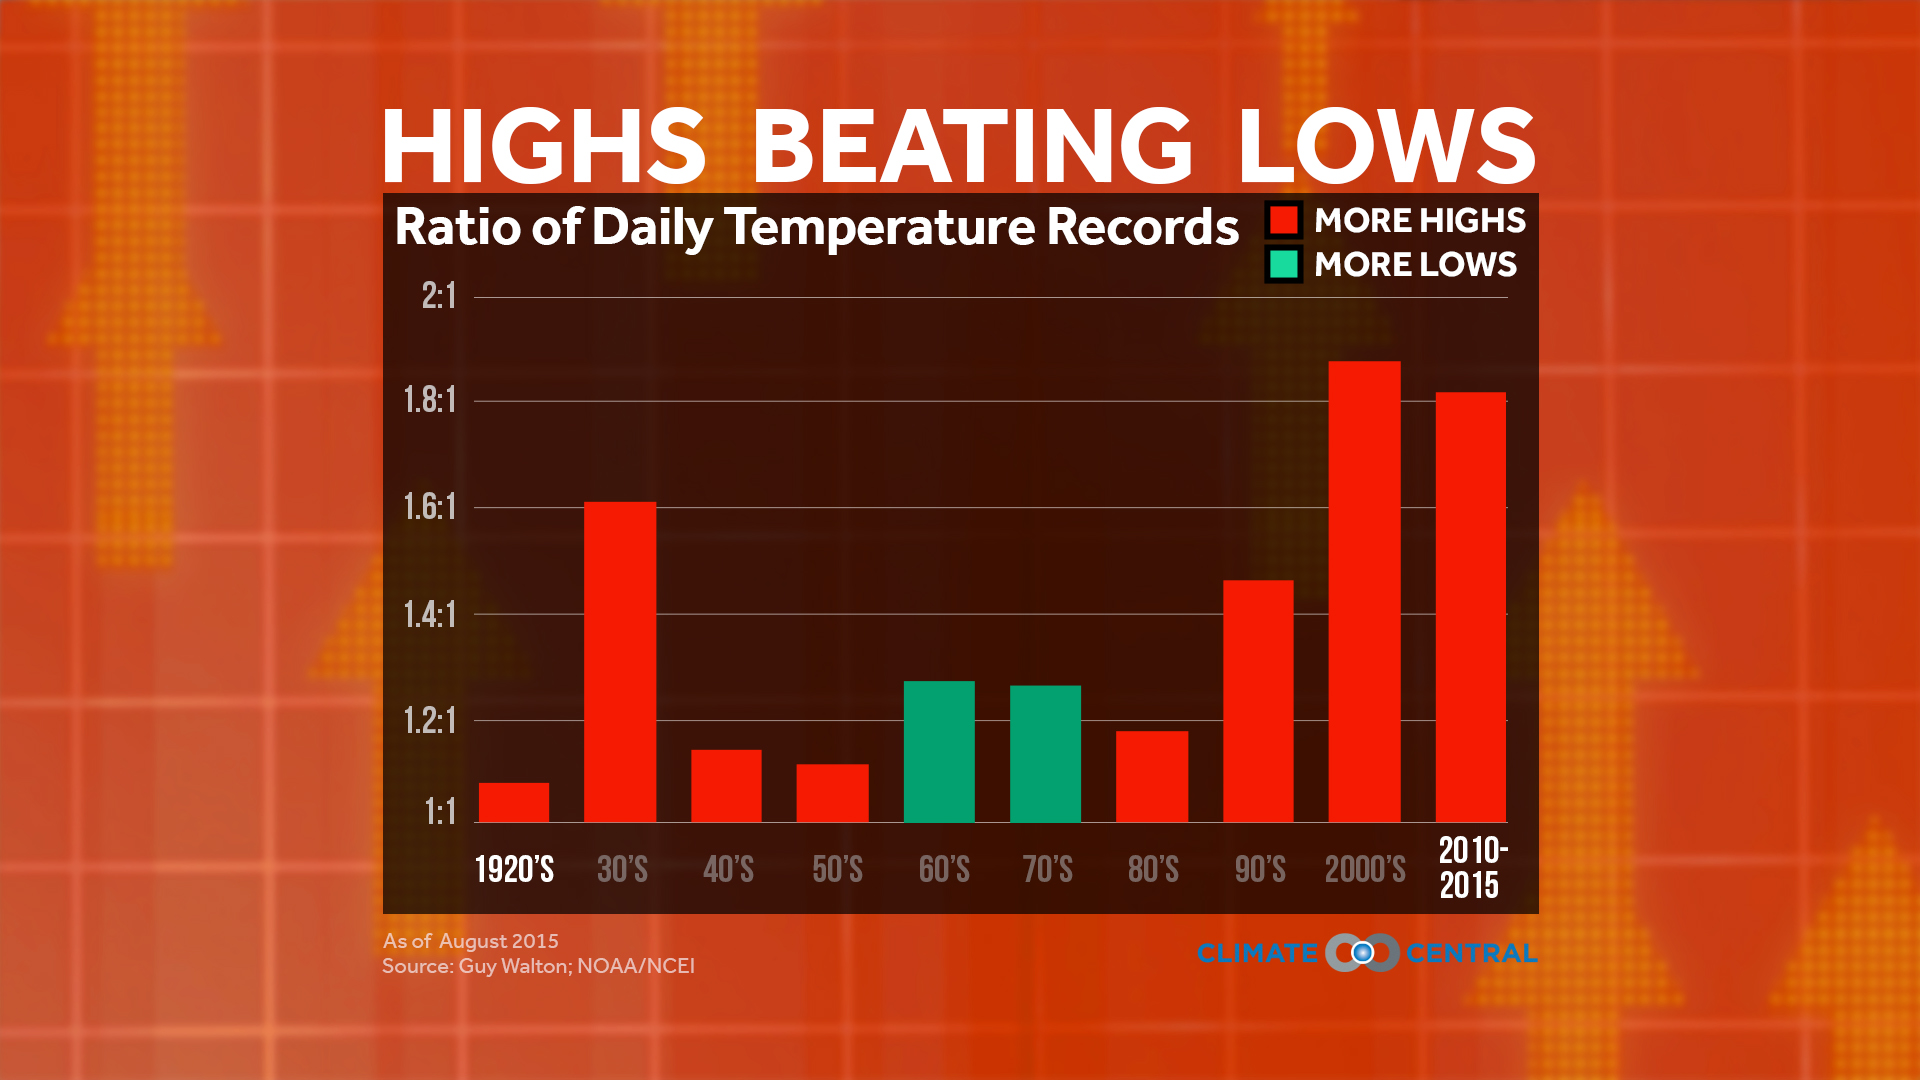
Without climate change, the ratio of daily record highs to daily record lows should be in balance when looking over years and decades — although there will still be swings to cold and hot years. However, over the last several decades in the U.S. record highs are significantly outpacing record lows, which indicates a long-term and sustained warming trend.
Despite the record heat dominating the West the past two years, the relatively chilly air across the East has been enough to tip the balance in favor of lows over highs (although the ratio is nearly 1-to-1). But the daily record highs have come roaring back this year, outpacing record lows nearly 2-to-1 since the beginning of 2015.
If we look in terms of decades, the 2000s and 2010s have seen record highs outweigh record lows by a higher ratio than any other decade in the last century, even during the notoriously hot Dust Bowl era of the 1930s. The number of record highs being set is especially telling because the statistical chance of breaking a record decreases as the length of time records are kept increases.
Examining all of the record low temperatures yields another dramatic result — since the first of the year, the number of all-time warm low-temperature records is outpacing the corresponding cold ones by a ratio of more than 6-to-1. This emphasizes that warmer nights are a major factor in the overall warming trend, not just hotter days.
As greenhouse gas emissions continue to accumulate in the atmosphere and warm the planet, record warm temperatures will further outpace record cold temperatures. In fact, model projections show that the ratio of daily record highs to lows will be around 20-to-1 by mid-century, growing to 50-to-1 by the end of the century (according to the A1B emission scenario).
NOTE: If you would like to find the latest record tally, The National Centers of Environmental Information (formerly NCDC), maintains a running summary.


I would bet 1000:1 odds that you don't even know who the hell Wang is.Everybody knows what you are spewing now, retard....really dumbfuck fraudulent anti-science denier cult myths and incoherent crackpot drivel!Were Chinese Stevenson screen meteorological instrumental records very accurate during the Cultural Revolution when damn near everyone who looked older than 12 years old was systematically slaughtered by the Mao government?and how much of the globe has temperature stations?
The Earth is a big place. The U.S. only covers less than 2% of the Earth's surface. Globally, 2014 was the hottest year on record at that time, although that record was broken again, by an even larger margin in 2015, and will very likely be broken yet again in 2016.
Looking at just one year in just the USA does not reflect the global picture. A longer time frame is essential to understanding the trend.
In the USA, 2012 was the hottest year on record by a large margin, and the ratio of record highs to record lows mirrored that. 2016 may wind up as the next new hottest year on record in the USA.
The interactive above shows the top 10 states with the biggest difference between the number of high-temperature and low-temperature records under the Ratio to Low tab at the top. Ohio has thus far seen 49 high-temperature records set for every one low-temperature record. Maryland and Wisconsin have both seen about 41 record highs for every one record low. All of the states in the top 10 have seen more than 20 record highs for every record low, and there hasn’t been a single state that has seen more low-temperature records than highs (or even a 1:1 ratio). Of note is Rhode Island, where there has not been a single low-temperature record set yet in 2012.
2013 and 2014 were a bit cooler in the U.S., but in 2015 he ratio of record highs to record lows has once again shifted to more record highs than record lows.
Record Highs vs. Record Lows
ClimateCentral
Aug 19th, 2015
This year is on pace to be the hottest on record globally, coming off a record hot year in 2014. Looking closer to home, parts of the western U.S. are also in the midst of one of their hottest years on record so far. Another important set of records are the daily records set at stations across the country.
Without climate change, the ratio of daily record highs to daily record lows should be in balance when looking over years and decades — although there will still be swings to cold and hot years. However, over the last several decades in the U.S. record highs are significantly outpacing record lows, which indicates a long-term and sustained warming trend.
Despite the record heat dominating the West the past two years, the relatively chilly air across the East has been enough to tip the balance in favor of lows over highs (although the ratio is nearly 1-to-1). But the daily record highs have come roaring back this year, outpacing record lows nearly 2-to-1 since the beginning of 2015.
If we look in terms of decades, the 2000s and 2010s have seen record highs outweigh record lows by a higher ratio than any other decade in the last century, even during the notoriously hot Dust Bowl era of the 1930s. The number of record highs being set is especially telling because the statistical chance of breaking a record decreases as the length of time records are kept increases.
Examining all of the record low temperatures yields another dramatic result — since the first of the year, the number of all-time warm low-temperature records is outpacing the corresponding cold ones by a ratio of more than 6-to-1. This emphasizes that warmer nights are a major factor in the overall warming trend, not just hotter days.
As greenhouse gas emissions continue to accumulate in the atmosphere and warm the planet, record warm temperatures will further outpace record cold temperatures. In fact, model projections show that the ratio of daily record highs to lows will be around 20-to-1 by mid-century, growing to 50-to-1 by the end of the century (according to the A1B emission scenario).
NOTE: If you would like to find the latest record tally, The National Centers of Environmental Information (formerly NCDC), maintains a running summary.
Wang admitted that he lied about the weather station locations. Hansen called bullshit in the e-mails that a WikiLinks whistle-blower exposed to the scientific community. (Climategate) They were flat out stone cold busted!
But idiots like RT and OR do not know what the **** I'm talking about. They are that clueless.
You are not a scientist. I am a scientist. You are a nutjob.