Actual measurements of course.
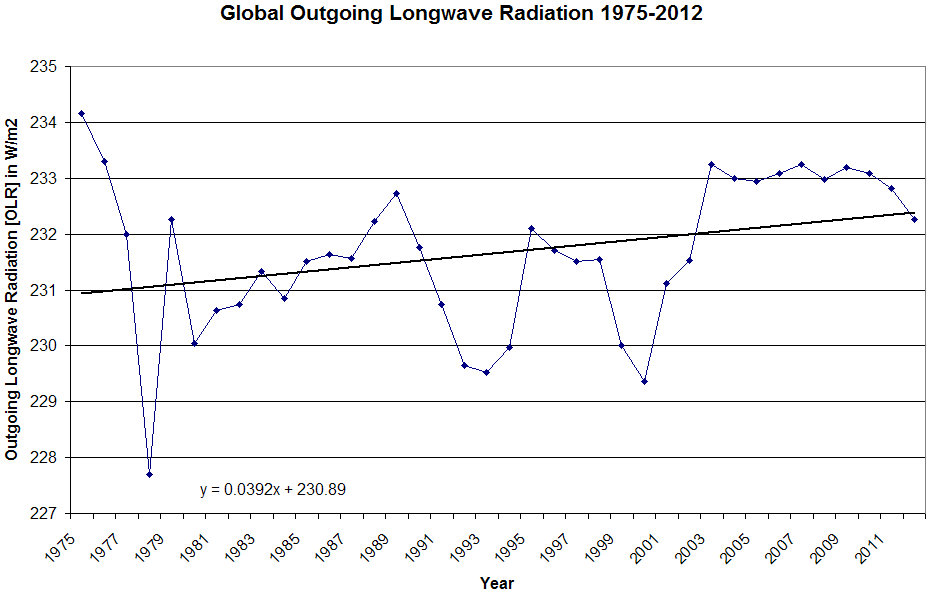
You misspelled "Yet another mystery graph I got from a denier blog". Such mystery graphs are all you have, which is one big reason we know you're parroting cult pseudoscience.
Meanwhile, the rational people can point to actual documented peer-reviewed data. Like this. There's plenty more, but first I want to watch you flail about making up reasons why these are part of the great conspiracy. Then we can move on to the others.
Satellite-Based Reconstruction of the Tropical Oceanic Clear-Sky Outgoing Longwave Radiation and Comparison with Climate Models -- Gastineau et al. (2014)
An Error Occurred Setting Your User Cookie
---
While the tropical ocean surface temperature has risen by roughly 0.2 K from 1982 to 2004, the reconstructed OLR remains stable over the ocean. Consequently, there is an increase in the clear-sky greenhouse effect (GHE) of 0.80 W m^2 decade−1
---
A decade of measured greenhouse forcings from AIRS Chapman et al. (2013)
SPIE | Proceeding | A decade of measured greenhouse forcings from AIRS
---
Decadal trends for AIRS spectra from 2002-2012 indicate continued decrease of -0.06 K/yr in the trend of CO2 BT (700cm-1 and 2250cm-1), a decrease of -0.04 K/yr of O3 BT (1050 cm-1), and a decrease of -0.03 K/yr of the CH4 BT (1300cm-1).
---
Spectral signatures of climate change in the Earths infrared spectrum between 1970 and 2006 -- Chen et al. (2007)
https://www.eumetsat.int/cs/idcplg?...veAs=1&RevisionSelectionMethod=LatestReleased
---
Previously published work using satellite observations of the clear sky infrared emitted radiation by the Earth in 1970, 1997 and in 2003 showed the appearance of changes in the outgoing spectrum, which agreed with those expected from known changes in the concentrations of well-mixed greenhouse gases over this period. Thus, the greenhouse forcing of the Earth has been observed to change in response to these concentration changes.
---


") of the three averages for the spectral regions 700–1150 and 1200–1400 cm−1, respectively. Previous similar analyses for the IRIS data have been reported, for example by Iacano and Clough (1996), though this is the first comparison for all three instruments. The similarity of the standard deviation should be noted, indicating that the three average spectra have been equally well cloud-cleared. Working from lower to higher wavenumbers, we note the following:
of the three averages for the spectral regions 700–1150 and 1200–1400 cm−1, respectively. Previous similar analyses for the IRIS data have been reported, for example by Iacano and Clough (1996), though this is the first comparison for all three instruments. The similarity of the standard deviation should be noted, indicating that the three average spectra have been equally well cloud-cleared. Working from lower to higher wavenumbers, we note the following: