CrusaderFrank
Diamond Member
- May 20, 2009
- 160,633
- 87,089
- 2,645
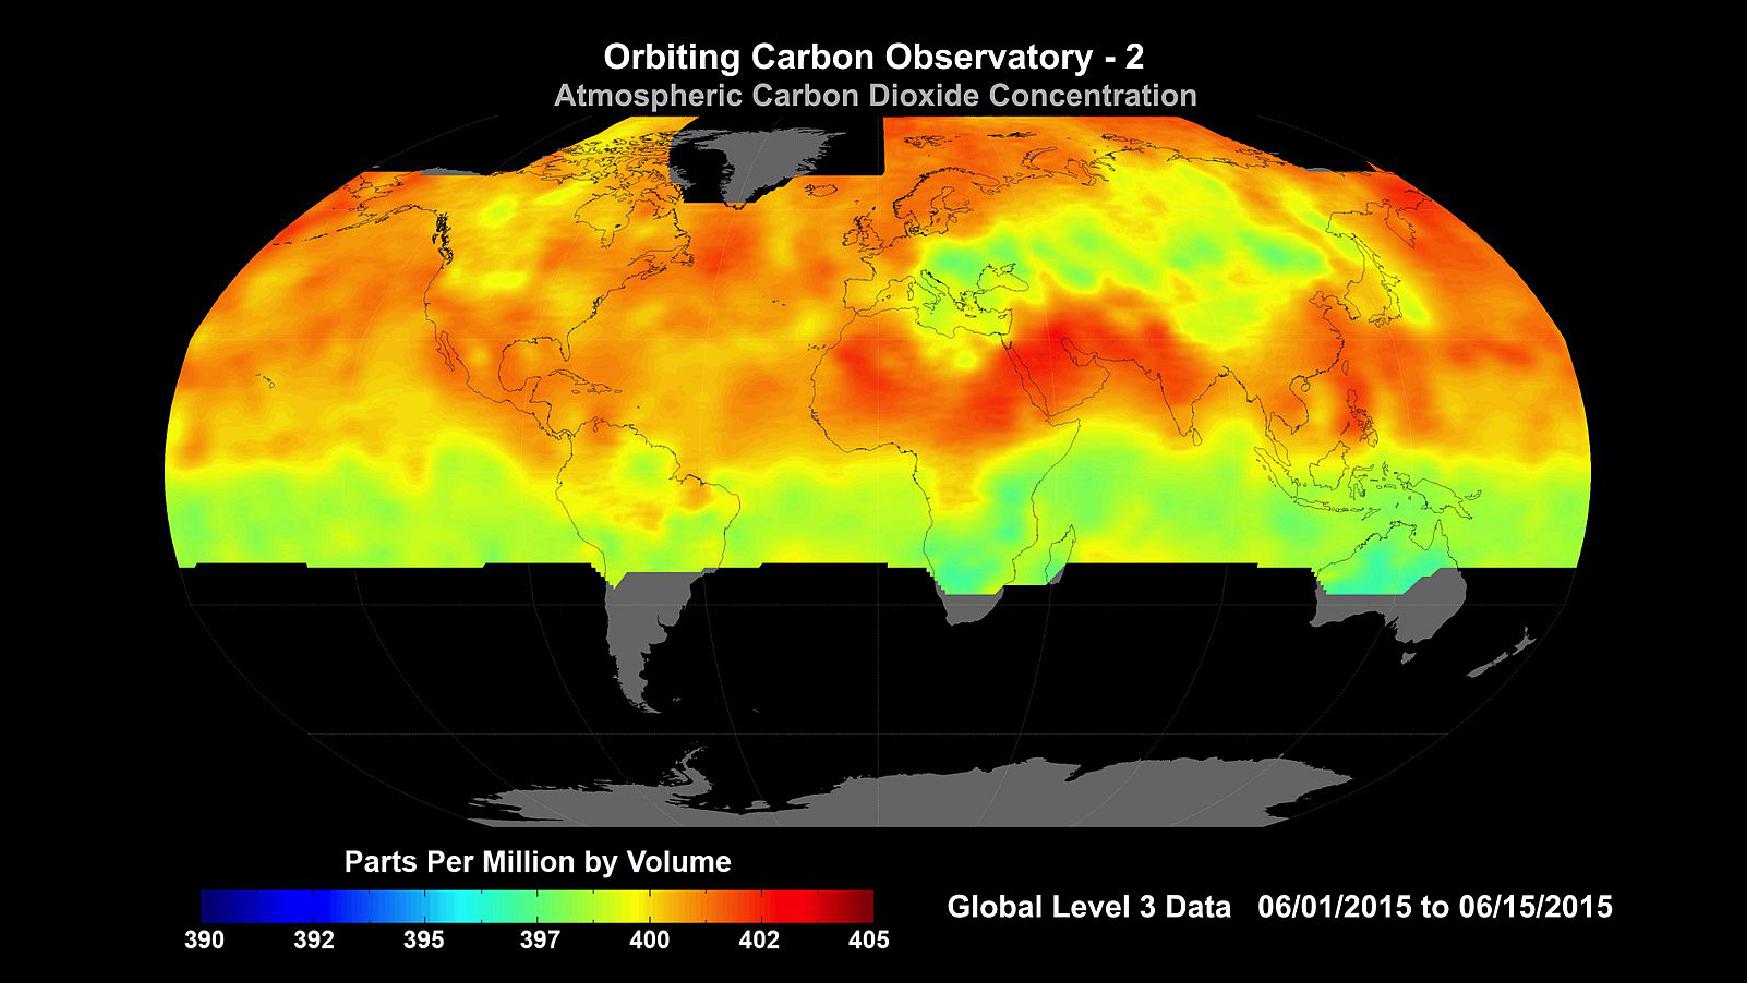
Here are the readings from 6/1/15 to 6/15/15

Oct 1 to Nov 11, 2014
What are these readings telling us?
The satellite was launched in July 2014
Last edited:
Follow along with the video below to see how to install our site as a web app on your home screen.
Note: This feature may not be available in some browsers.
Let's think about this logically. If man's over use of fossil fuels is driving climate change then it's quite obvious that during the Covid shut downs throughout the pandemic that had much of the world's population sheltering at home we should have seen a dramatic drop in temperature? Correct? So where was that? Climate zealots want cars off the road! During the pandemic cities like New York were literal ghost towns with almost no cars driving around as people stayed home. So where was the change in climate?
Think of it, all the real scientific evidence shows that: Mankind has virtually no impact on CO2, which itself does not drive the climate on planet Earth....but they keep repeating the failed hypothesis
Madness!
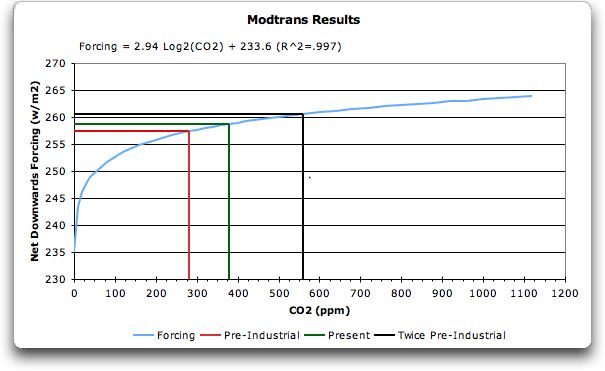
That would explain why the AGW Cult mamooth et.al. NEVER give us a real, non imaginary number for the temperature “increase” from an increase in CO2 from 280 to 400ppm. They lie and lie and lie and curse and mock and lie and lieYup since it is well known that most of the postulated warm forcing of CO2 was in the first 60 ppm then a rapid decrease afterwards.

Final Jeopardy$76 trillion?
evil fks that want power over people.Think of it, all the real scientific evidence shows that: Mankind has virtually no impact on CO2, which itself does not drive the climate on planet Earth....but they keep repeating the failed hypothesis
Madness!
Frank, I've thought about that question, and the real question in my mind is how much CO2 does one ICE vehicle contribute? Coal Power plant? I mean, if they say they can track CO2 now, your earlier graphs, then what is the CO2 out of car or plant?Final Jeopardy
By how much must we lower CO2 to stop Manmade global Climate warming Change?
Cool. I live rent-free in Frank's little cult head. What a loser. He's even pout-stalking me now. I own that *****, and rent him out for gangbangs.That would explain why the AGW Cult mamooth et.al. NEVER give us a real, non imaginary number for the temperature “increase” from an increase in CO2 from 280 to 400ppm. They lie and lie and lie and curse and mock and lie and lie
Are you saying that increasing CO2 from 280 to 400ppm will raise temperature 1.5C?Cool. I live rent-free in Frank's little cult head. What a loser. He's even pout-stalking me now. I own that *****, and rent him out for gangbangs.
And, Frank? **** off, you sad little troll.
And yes, I have told him before. 280 to 400 is, logarithmically, half a doubling. That eventually gives 1.5C warming, since climate sensitivity is about 3.0C per doubling. It's a trivial question, so he looks really stupid when he acts like it's some sort of gotcha.
Also, given that the isotope ratios prove the CO2 increase comes from burning fossil fuels, you have to be some special type of stupid to claim it doesn't. Frank and his fanbois here all are that type of stupid.
So, what are the images showing? That CO2 is absorbed during the growing season. But June isn't early enough. Not much has grown. In the northern hemisphere, the winter's accumulation of CO2 starts reversing in July, and reaches a minimum in September.
Actually the “highest” readings were from the Equatorial rain forests in Brazil, Africa and Indonesia.I see a map showing the heaviest CO2 concentrations in the countries that are basically exempted from climate regulations.
The theory of AGW is an IQ test to show who the dumbest people are.
The crazier you are about climate change, the lower your IQ registers.
Keep virtue signaling morons
That almost nine years ago CO2 concentrations were already over 400 ppm over large parts of the planet.
Here are the readings from 6/1/15 to 6/15/15
Oct 1 to Nov 11, 2014
What are these readings telling us?
The satellite was launched in July 2014
The scale goes from 397 to 405.....8PPM , a rounding errorThat almost nine years ago CO2 concentrations were already over 400 ppm over large parts of the planet.
Clean your glasses. It goes from 390 to 405.The scale goes from 397 to 405.....8PPM , a rounding error
Not correct. Co2 remains up there for a looooong time.Let's think about this logically. If man's over use of fossil fuels is driving climate change then it's quite obvious that during the Covid shut downs throughout the pandemic that had much of the world's population sheltering at home we should have seen a dramatic drop in temperature? Correct? So where was that? Climate zealots want cars off the road! During the pandemic cities like New York were literal ghost towns with almost no cars driving around as people stayed home. So where was the change in climate?
