Climate Sensitivity per the IPCC

The image below is the Down Welling Solar Radiation distribution into our oceans.

Practical Handbook of Marine Science (routledgehandbooks.com)

attachment.php


You note the notations on the graph above for 100m, 10m, 1m, 1cm, and surface. These are the regions of DWSR and what in the ocean they affect. Anything larger in wavelength than 1.1 (1100nm) will impact the skin of the ocean and be defeated in the evaporation layer. (First ten microns) The layer just below this is about 150 microns in depth and is cooler than the evaporation layer. Even with mixing from waves, the energy that impacts the skin is too small to generate heat into the oceans due to the mixing with the colder region.
How many times how have you been told of the studies showing how the heating in the thermal skin layer reduces transfer from deeper water so, effectively, heats the oceans? Twice? Three times? More? Yet you pretend you never heard such a thing.
This graph demonstrates how a minor shift in energy output on our sun can directly affect our oceans. Over 90% of the energy into our oceans occurs in the 380nm to 540nm region. A 5% shift from this region to 1.0-1.4um would put the energy outside the ability for most of the ocean to absorb.

The shift in energy that affected our solar panel arrays is in the same region that affects our oceans. The PV arrays lost 10% of their output, indicating at least that amount of shift in power from the sun. If approximately 5% of that energy falls in the primary ocean heating area this can affect our oceans uptake of 345W/m^2, were looking at a potential change nearing 16W/m^2 and the reason our ENSO is not recharging, and our oceans are cooling.
This sort of statement demands (per USMB rules) a link to a reputable source.
Responses from some of my colleagues was disbelief, until they began crunching the numbers for themselves. When they looked at the shift in the energy regions which had little effect on TSI, it stunned them.

Source
Then let's hear from some of your "colleagues".
 
How many times how have you been told of the studies showing how the heating in the thermal skin layer reduces transfer from deeper water so, effectively, heats the oceans? Twice? Three times? More? Yet you pretend you never heard such a thing.

This sort of statement demands (per USMB rules) a link to a reputable source.

Then let's hear from some of your "colleagues".


LOL!!!

What COOLS the oceans....????


Perhaps ICE????


Antarctica dumps 46 times the amount of H2O the Mississippi River does into the oceans, 9 times what the Arctic does, and the Arctic ice is not as cold....

And that is a clue, that one polar circle cools the oceans more than 9 times the other.... WHY
 
How many times how have you been told of the studies showing how the heating in the thermal skin layer reduces transfer from deeper water so, effectively, heats the oceans? Twice? Three times? More? Yet you pretend you never heard such a thing.

This sort of statement demands (per USMB rules) a link to a reputable source.

Then let's hear from some of your "colleagues".
I did a search on "has there been a frequency shift in solar radiation to earth?"

A 1980 (43 year old) article on solar fluctuations may be seen at: Solar Energy Fluctuations Detected. It says "The satellite has measured increases and decreases of solar radiation of up to eight/one-hundredths percent in its first month of operation."

A newer artice (2021) that suggests there must be larger variations in TSI than have been detected in the 40 years of satellite observations because the magnitude of the cooling during the LIA was greater than the known direct TSI changes could have produced. Changes in the Total Solar Irradiance and climatic effects | Journal of Space Weather and Space Climate
What is pertinent in this article is that there is no mention of the changes you claim have taken place over the last several decades.

Trenberth & Cheng 2022: ShieldSquare Captcha. Lots of discussion of changes in TSI. No mention of any change in frequency. Yet you claim a 10% drop in PV output from a frequency change in solar radiation. That would be a massive change and should be making headlines. But, perhaps I've missed it. Can't wait to see what you've got.
 
I don't have to, to prove AGW.
Apparently you found out the Ocean DOES get warmed down 500M by the sun alone.
Then there is slow mixing of water if everything around it Is warmer too.
Obviously water mixes/currents meet over time.
BTW Fvkk You dipshlt.
`
I have just demonstrated why this cannot happen except in a very narrow band of DWSR. Please share with the class how you defeat the laws of thermodynamics to accomplish these feets of which you speak.

Please show your work on how a low energy wave in the 12-16um range is not stopped by the TSL and placed back into the atmosphere. Only a very narrow portion of the DWSR is heating our oceans to depths of 700m. And the further you get from the 90deg angle of incidence, the depth of penetration diminishes rapidly.
How can you mix a 10 micron thick region with a cooler 150-160 micron region and get warming when the evaporation in that region will not allow heat to build up? This is simple physics.

You're missing very key components to how the system works. That is why your AGW hypothesis has been falsified.
 
How many times how have you been told of the studies showing how the heating in the thermal skin layer reduces transfer from deeper water so, effectively, heats the oceans? Twice? Three times? More? Yet you pretend you never heard such a thing.
LOL.... Wong 2018 postulated this, and they could not prove it. You may want to go back and read their work for the first time. "modulation" of the upward thermal column. Please share with the class how this is done and how they determined this. Wong stated "we do not know if this happens as we cannot isolate any key component which could cause this"

The dates of comparison are 2007 and 2012 on June 23 at 1200 hours. This was the closest day to neutral position of our sun above the equator. This graph shows a 16W/m^2 shift in power from the bands that warm our oceans to depth to a region that they cannot absorb. The shift is readily apparent in this graphing.

attachment.php

You will note: the red shaded wavelengths are what warm our oceans to depths of 700 meters. The yellow shaded wavelengths go to around 10 meters. Beyond that they impact the evaporation layers.


This was generated from the public access data at


Here is the energy penetration graph to compare what is affected by the shift in energy on our sun.

attachment.php
 
How many times how have you been told of the studies showing how the heating in the thermal skin layer reduces transfer from deeper water so, effectively, heats the oceans? Twice? Three times? More? Yet you pretend you never heard such a thing.

This sort of statement demands (per USMB rules) a link to a reputable source.

Then let's hear from some of your "colleagues".
You were given the source of the data. You don't like what it says, GFY and find another source. Mine is NOAA, NASA and NWS....
 
You were given the source of the data. You don't like what it says, GFY and find another source. Mine is NOAA, NASA and NWS....
I am doing a search of your posts looking for the "source of the data" that the ocean is unable to absorb IR energy you claim to have provided. Simply looking for NOAA and NASA since the beginning of this year pulls up only two posts of yours, neither of which has a link to anything. I will keep searching.
 
All we know for certain is that

"But one must say clearly that we redistribute de facto the world’s wealth by climate policy..." Ottmar Edenhofer, IPCC
 
A newer artice (2021) that suggests there must be larger variations in TSI than have been detected in the 40 years of satellite observations because the magnitude of the cooling during the LIA was greater than the known direct TSI changes could have produced. Changes in the Total Solar Irradiance and climatic effects | Journal of Space Weather and Space Climate
What is pertinent in this article is that there is no mention of the changes you claim have taken place over the last several decades.
What it says is it is inconclusive. Look up the word.
 
I am doing a search of your posts looking for the "source of the data" that the ocean is unable to absorb IR energy you claim to have provided. Simply looking for NOAA and NASA since the beginning of this year pulls up only two posts of yours, neither of which has a link to anything. I will keep searching.
Tell me what happens to solar output when the plasma is cooling on the surface? This is simply a continuation of the cooling that started around 2009.

 
LOL.... Wong 2018 postulated this, and they could not prove it. You may want to go back and read their work for the first time. "modulation" of the upward thermal column. Please share with the class how this is done and how they determined this. Wong stated "we do not know if this happens as we cannot isolate any key component which could cause this"

The dates of comparison are 2007 and 2012 on June 23 at 1200 hours. This was the closest day to neutral position of our sun above the equator. This graph shows a 16W/m^2 shift in power from the bands that warm our oceans to depth to a region that they cannot absorb. The shift is readily apparent in this graphing.

attachment.php

You will note: the red shaded wavelengths are what warm our oceans to depths of 700 meters. The yellow shaded wavelengths go to around 10 meters. Beyond that they impact the evaporation layers.


This was generated from the public access data at


Here is the energy penetration graph to compare what is affected by the shift in energy on our sun.

attachment.php
Are you calling your Goofy Home Made Graphs "NOAA, NASA, etc" when there is NO Credit on the graph itself?

And WTF do HOURLY graphs have to do with 150 YEARS of GLOBAL Warming... or Not?

Your usual 'PatriotWeather.us' source? .... your and SunsetMommy's personal Blog/storehouse of Laughs/Goofy Graphs no doubt.

`
 
Last edited:
I have just demonstrated why this cannot happen except in a very narrow band of DWSR. Please share with the class how you defeat the laws of thermodynamics to accomplish these feets of which you speak.

Please show your work on how a low energy wave in the 12-16um range is not stopped by the TSL and placed back into the atmosphere.
I really tire of this "show us your work" bullshit. You haven't shown us any of YOUR work.
Only a very narrow portion of the DWSR is heating our oceans to depths of 700m. And the further you get from the 90deg angle of incidence, the depth of penetration diminishes rapidly.
How can you mix a 10 micron thick region with a cooler 150-160 micron region and get warming when the evaporation in that region will not allow heat to build up? This is simple physics.
It's wrong physics. Mixing in the ocean surface is widespread, vigorous and robust but the mechanism determined in Wong 2018 (https://agupubs.onlinelibrary.wiley.com/doi/full/10.1002/2017JC013351) is that heating of the thermal skin layer prevents transfer from below. As far back as Levitus 2012 the correlation between deeper ocean hearing in response to increased greenhouse warming has been demonstrated. Wong 2018's conclusions are understood to be the mechanism involved and is well cited. See: Evaluation of Regional Surface Energy Budget Over Ocean Derived From Satellites
You're missing very key components to how the system works. That is why your AGW hypothesis has been falsified.
And what "key components " might those be?
 
This topic comes up now and then and I thought it might be handy to have some reference material. This first post is the glossary entries under "Climate Sensitivity"

Climate sensitivity The change in the surface temperature
in response to a change in the atmospheric carbon dioxide (CO2)
concentration or other radiative forcing. See also Climate feedback
parameter.
Earth system sensitivity
The equilibrium surface temperature response of the coupled
atmosphere–ocean–cryosphere–vegetation–carbon cycle system to
a doubling of the atmospheric carbon dioxide (CO2) concentration
is referred to as Earth system sensitivity. Because it allows ice sheets
to adjust to the external perturbation, it may differ substantially from
the equilibrium climate sensitivity derived from coupled atmosphere–
ocean models.
Effective equilibrium climate sensitivity
An estimate of the surface temperature response to a doubling of
the atmospheric carbon dioxide (CO2) concentration that is evaluated
from model output or observations for evolving non-equilibrium
conditions. It is a measure of the strengths of the climate feedbacks at
a particular time and may vary with forcing history and climate state,
and therefore may differ from equilibrium climate sensitivity.
Equilibrium climate sensitivity (ECS)
The equilibrium (steady state) change in the surface temperature
following a doubling of the atmospheric carbon dioxide (CO2)
concentration from pre-industrial conditions.
Transient climate response (TCR)
The surface temperature response for the hypothetical scenario
in which atmospheric carbon dioxide (CO2) increases at 1% yr–1
from pre-industrial to the time of a doubling of atmospheric CO2
concentration (year 70).
Transient climate response to cumulative CO2 emissions (TCRE)
The transient surface temperature change per unit cumulative carbon
dioxide (CO2) emissions, usually 1000 GtC. TCRE combines both
information on the airborne fraction of cumulative CO2 emissions
(the fraction of the total CO2 emitted that remains in the atmosphere,
which is determined by carbon cycle processes) and on the transient
climate response (TCR).

"The Earth’s Energy Budget, Climate Feedbacks and Climate Sensitivity", Chapter 7 of "The Physical Science Basis" in the IPCC's Assessment Report 6 is the place to cover this topic. If you don't already have one, you can download a copy of the entire document at:

AR6 Climate Change 2021: The Physical Science Basis — IPCC

Chapter 7 begins on page 923. Climate Feedbacks are discussed in section 7.4, beginning on page 967. Estimate of ECS and TCR are discussed in section 7.5, beginning on page 992

So odd that CO2 doubled, but temperatures DECLINED for 75,000 years, right?

vostok_T_CO2.png


If CO2 were a driver of the climate as you allege, the redline would be TO THE LEFT of the CO2 blue line
 
I really tire of this "show us your work" bullshit. You haven't shown us any of YOUR work.

It's wrong physics. Mixing in the ocean surface is widespread, vigorous and robust but the mechanism determined in Wong 2018 (https://agupubs.onlinelibrary.wiley.com/doi/full/10.1002/2017JC013351) is that heating of the thermal skin layer prevents transfer from below. As far back as Levitus 2012 the correlation between deeper ocean hearing in response to increased greenhouse warming has been demonstrated. Wong 2018's conclusions are understood to be the mechanism involved and is well cited. See: Evaluation of Regional Surface Energy Budget Over Ocean Derived From Satellites

And what "key components " might those be?
I really tire of incompetence and ignorance. I gave you the data on which I made my judgments. That is how science is done. You can agree or disagree, but the data remains as does my interpetation of it.

Your "energy budget" is a model that uses a 3/1 Climate Sensitivity enhancement when one does not exist. That is why it exaggerates warming by no less than a factor of ten.

My assessment is one done with empirically observed data. Yours is a fantasy derived fiction using incorrect "enhancers" to get the desired result. You really should get to know your subject matter before you post it up.
 
Last edited:
So odd that CO2 doubled, but temperatures DECLINED for 75,000 years, right?

vostok_T_CO2.png


If CO2 were a driver of the climate as you allege, the redline would be TO THE LEFT of the CO2 blue line
Stupid and Dishonest FrusaderCrank keeps posting an IRRELEVANT graph at least once daily.

Asked and answered many times by me you Blithering Clocksucker.


Scientists have been able to measure radiation-in/radiation-out directly and precisely for more than 50 years.
Radiation-in has not changed as the earth warmed.
Radiation reflected back out is being blocked at the exact spectral wavelengths of the GHGs (Greenhouse gases)

CO2 is not the only GHG. (water vapor, Methane, etc)
Methane/CH4 is 20-80 as powerful. (from livestock), and the snowball effect of other GHG warming which releases more methane from the warming oceans and melting tundra.
CO2 is up from 280 PPM to 410, mainly in the last 70 (of 170) years.
Methane has Tripled.

Previous warming cycles were caused by orbital changes of angle or distance leading to more radiation-in, aka 'solar forcing.'
We/they know that is/was Not the case this time.

GHGs, as serious Deniers know/use, usually LAG that solar forcing... but this time are leading it! Because they also contribute to warming even in a natural cycle. (GHG definition).
This cycle was Not caused by increased solar energy but rather those gases increased/blanket thickened at an unprecedented rate Compared to natural cycles.


Get a New TOY you DISHONEST CLOCKSUCKER.

``
 
Tell me what happens to solar output when the plasma is cooling on the surface? This is simply a continuation of the cooling that started around 2009.

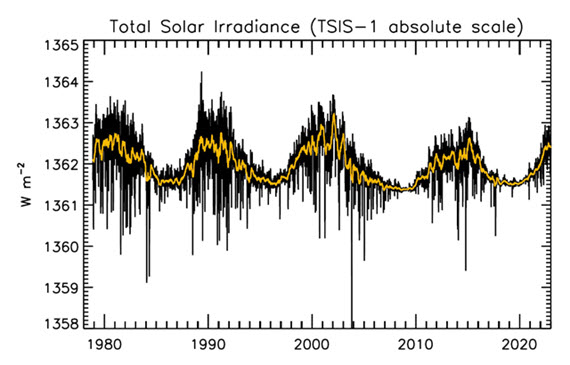
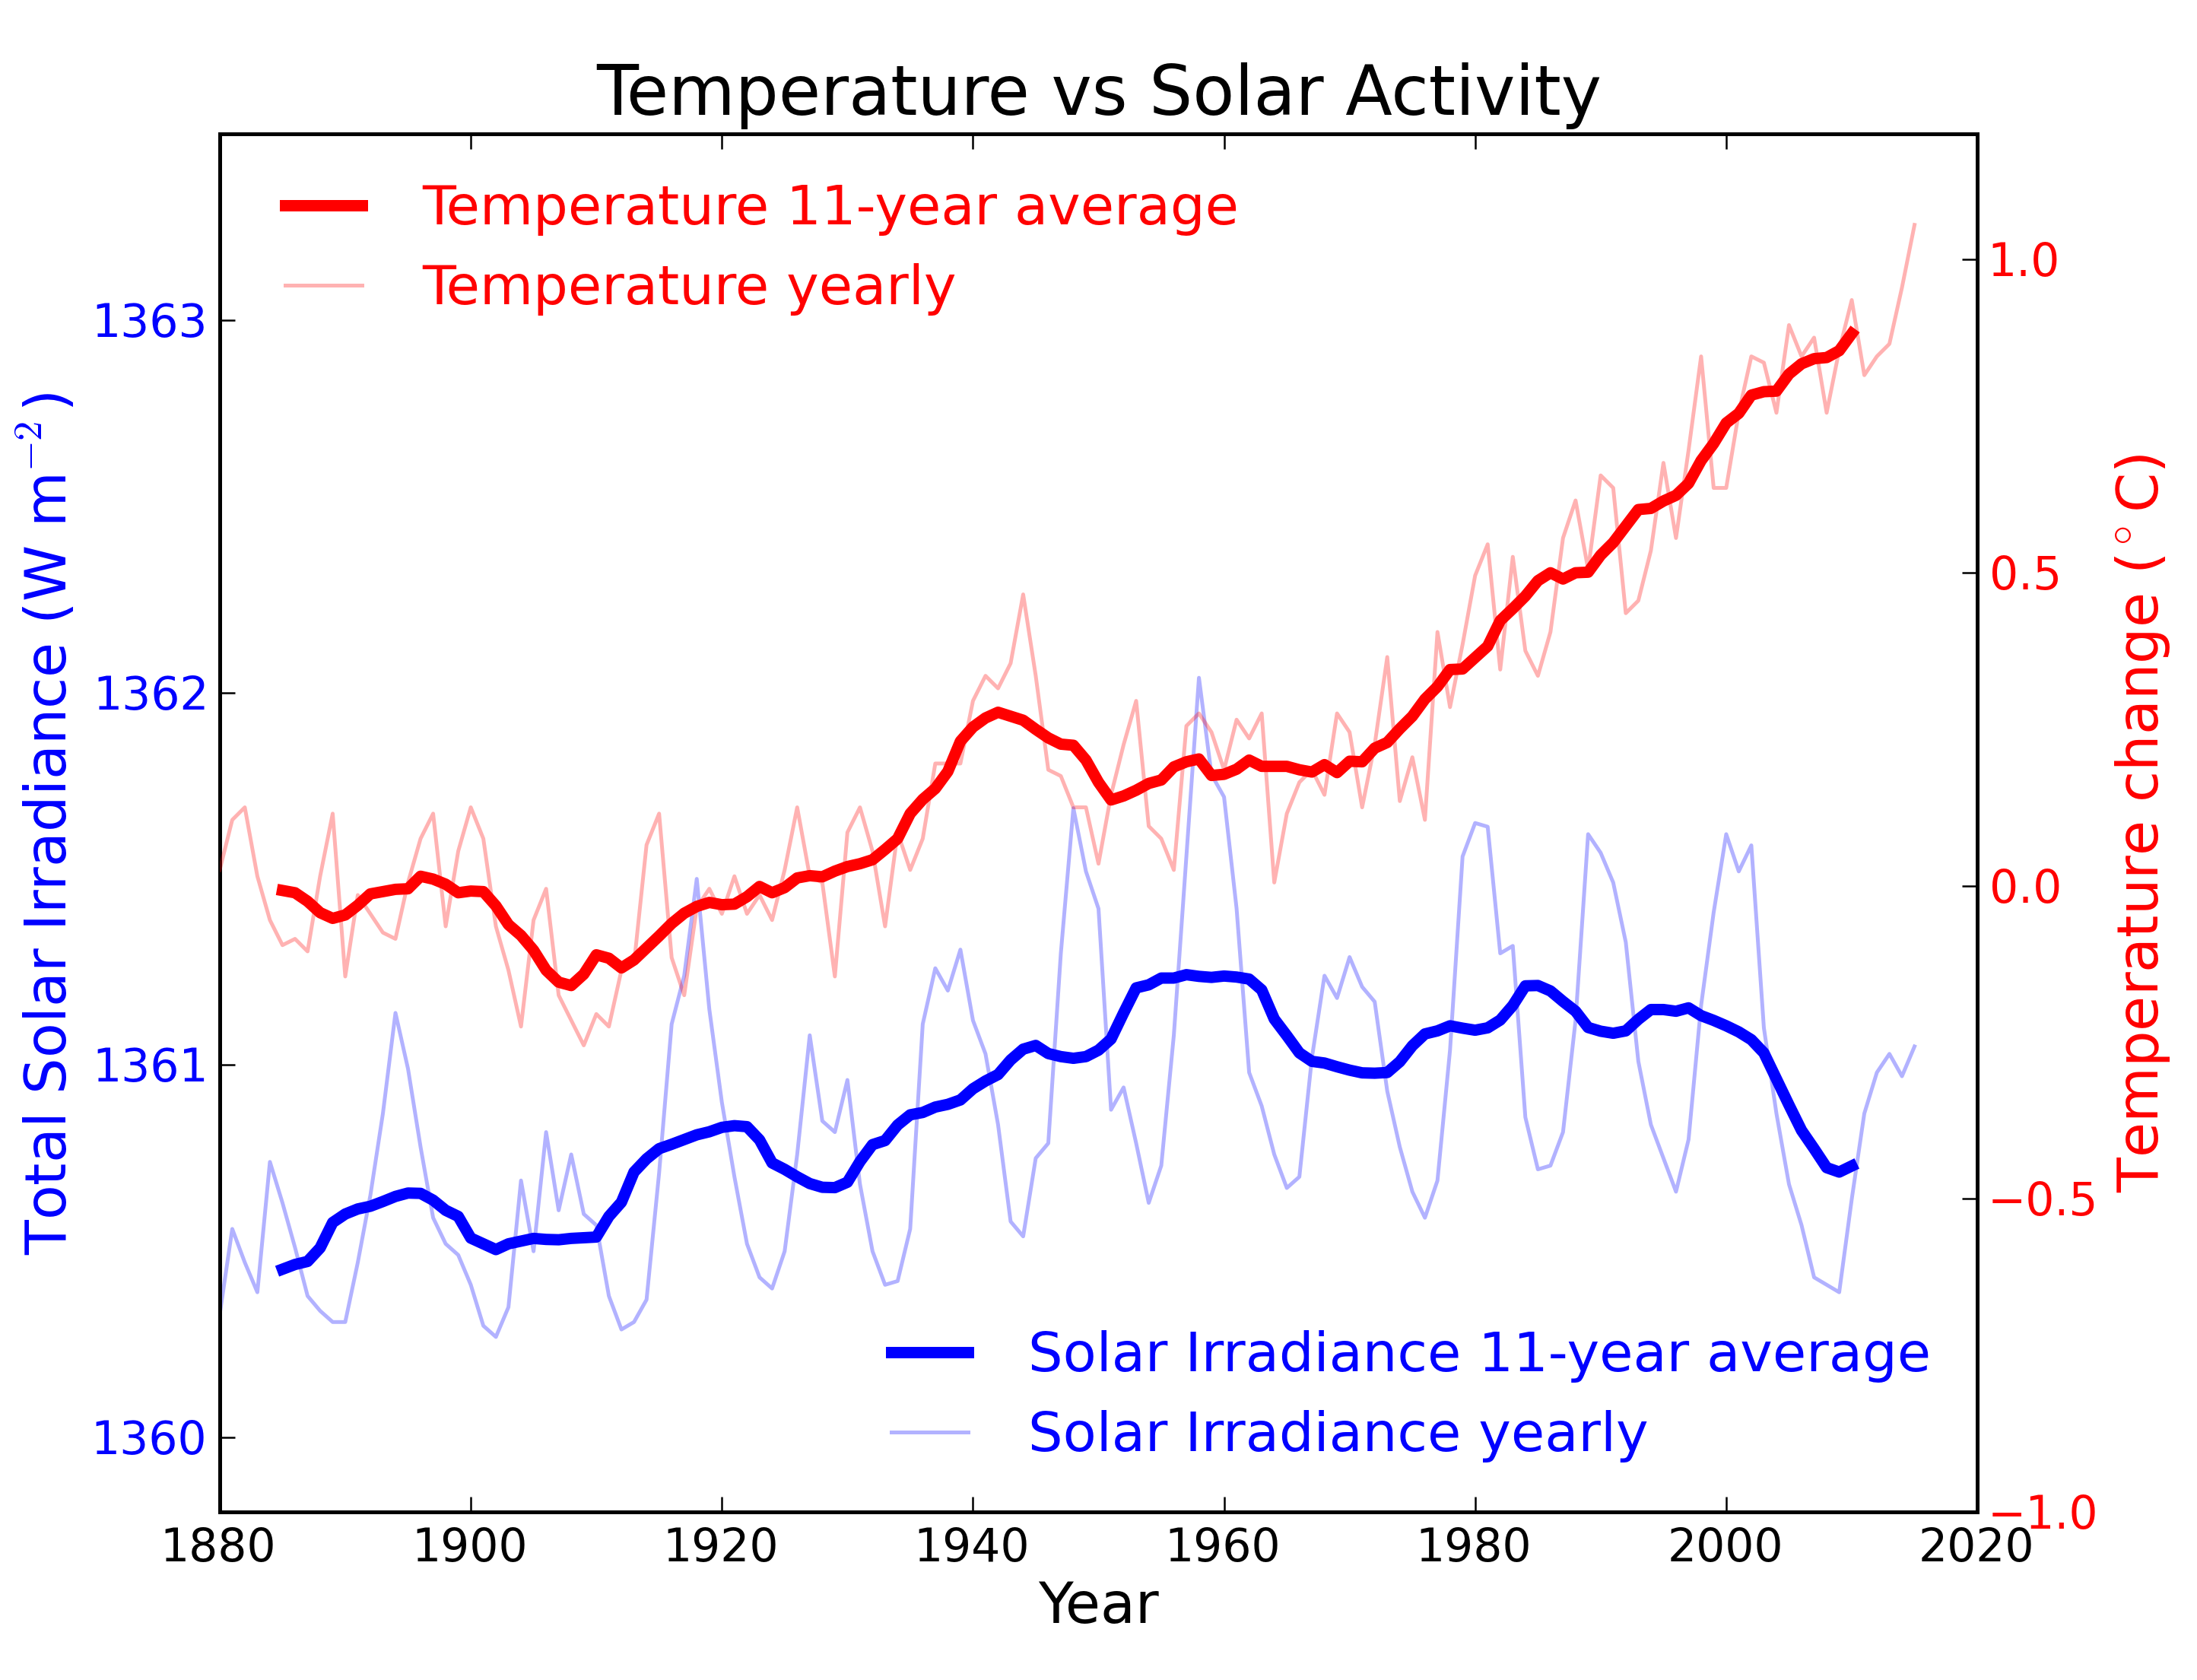
Not very much. There is almost no correlation whatsoever on this timescale between TSI and global Earth temperature. TSI is cyclical.

Rebuttal-Sun-Details-Figure-1-TSI-Solar-cycles-570px.jpg

Figure 1: Plot of the observational record (1979-2022) on the scale of the TSIS-1 instrument currently flying on the space station. In this plot, the different records are all cross calibrated to the TSIS-1 absolute scale (e.g., the TSIS1-absolute scale is 0.858 W/m^2 higher than the SORCE absolute scale) so the variability of TSI in this plot is considered to be its “true variability” (within cross calibration uncertainties). Image: Judith Lean.
TvsTSI.png

Figure 2: Annual global temperature change (thin light red) with 11 year moving average of temperature (thick dark red). Temperature from NASA GISS. Annual Total Solar Irradiance (thin light blue) with 11 year moving average of TSI (thick dark blue). TSI from 1880 to 1978 from Krivova et al. 2007. TSI from 1979 to 2015 from the World Radiation Center (see their PMOD index page for data updates). Plots of the most recent solar irradiance can be found at the Laboratory for Atmospheric and Space Physics LISIRD site.


David Archibald, frequent guest blogger on WUWT, has a BSc in geology, period, and has spent his career in the mining and oil industries. He claims to be a climate scientist but is not and never has been employed as such.

Archibald started working in coal and oil shale exploration in 1979, then went on to become a financial analyst and stockbroker before returning to oil companies in the 2000s. In 2003 he led an oil exploration company called Oilex, then joined a Canadian oil exploration company in 2006 at the same time he was CEO of mineral exploration company Westgold Resources. As of 2008, he was operating 8.6 million acres of oil exploration permits in Australia as of 2008. In a phone call with Media Matters, Archibald stated that he currently runs his own company in the oil industry.
 
I really tire of incompetence and ignorance.
I love the way you never drop down to personal insults.
I gave you the data on which I made my judgments. That is how science is done. You can agree or disagree, but the data remains as does my interpetation of it.

Your "energy budget" is a model that uses a 3/1 Climate Sensitivity enhancement when one does not exist. That is why it exaggerates warming by no less than a factor of ten.

My assessment is one done with empirically observed data. Yours is a fantasy derived fiction using incorrect "enhancers" to get the desired result. You really should get to know your subject matter before you post it up.
Show us the science you use to conclude there is no correlation between greenhouse heating and SST. Show us where Wong 2018 has been refuted.
 
I love the way you never drop down to personal insults.

Show us the science you use to conclude there is no correlation between greenhouse heating and SST. Show us where Wong 2018 has been refuted.
Everything you have posted is from a MODLE... It is not empirical evidence; it is made up crap.. Why do you trust modeling when it has failed 100% of the time? You try to discredit Empirically Observed Evidence by enhancing it using failed modeling. Why do you distort truth with fantasy?
 

Forum List

Back
Top