Climate scientist explains flaws in IPCC models and predictions

CrusaderFrank

Diamond Member
Joined
May 20, 2009
Messages
153,041
Reaction score
78,246
Points
2,645


You ever wonder why AGW Cult deals in anomalies and not actual temperatures ?

It’s because actual temperatures are DENIERS and must get adjusted and glossed over to make AGW work at all

Sabine was booted from the Global Warming Club for asking too many questions, also invalidating the 97% agree fiction
 
The entire case for Co2 based climate change in one single photo...

R.577de679b285aa7f970eec26afbd9c4e


You ever wonder why AGW Cult deals in anomalies and not actual temperatures ?

No. For example, what actual temperatures do you think a Vostok ice core records? What actual temperatures do you think tree rings in Ecuador record? Local temperatures. That's why.
It’s because actual temperatures are DENIERS and must get adjusted and glossed over to make AGW work at all
Anomalies are not "adjusted", they are calculated.
Sabine was booted from the Global Warming Club for asking too many questions, also invalidating the 97% agree fiction
Is Sabine the woman in the picture? What do you actually mean by "booted from the Global Warming Club"? Was anything actually done to her by anyone?


You ever wonder why AGW Cult deals in anomalies and not actual temperatures ?

It’s because actual temperatures are DENIERS and must get adjusted and glossed over to make AGW work at all

Sabine was booted from the Global Warming Club for asking too many questions, also invalidating the 97% agree fiction

Scientists come to opposite conclusions about the causes of recent climate change depending on which datasets they consider. For instance, the panels on the left lead to the conclusion that global temperature changes since the mid-19th century have been mostly due to human-caused emissions, especially carbon dioxide (CO2), i.e., the conclusion reached by the UN IPCC reports. In contrast, the panels on the right lead to the exact opposite conclusion, i.e., that the global temperature changes since the mid-19th century have been mostly due to natural cycles, chiefly long-term changes in the energy emitted by the Sun.


1632186412722.png


Both sets of panels are based on published scientific data, but each uses different datasets and assumptions. On the left, it is assumed that the available temperature records are unaffected by the urban heat island problem, and so all stations are used, whether urban or rural. On the right, only rural stations are used. Meanwhile, on the left, solar output is modeled using the low variability dataset that has been chosen for the IPCC’s upcoming (in 2021/2022) 6th Assessment Reports. This implies zero contribution from natural factors to the long-term warming. On the right, solar output is modeled using a high variability dataset used by the team in charge of NASA’s ACRIM sun-monitoring satellites. This implies that most, if not all, of the long-term temperature changes are due to natural factors.

Here is the link to the full paper.
ShieldSquare Captcha
Just as an FYI, the authors of this paper are a who's who of global warming deniers.

Why the large difference between the left and right data for "Sun and volcanoes only"?
 
Just as an FYI, the authors of this paper are a who's who of global warming deniers.

Why the large difference between the left and right data for "Sun and volcanoes only"?
I have long wondered why people like you are so fanatical to believe the AGW religionist group and so resistant to looking at any scientific study/thought/analysis that is contrary to the AGW religion?

Why is it that you trust the religionists so much and on what basis do you reject the skeptics many of whom have great credentials and experience?
 
Just as an FYI, the authors of this paper are a who's who of global warming deniers.

Why the large difference between the left and right data for "Sun and volcanoes only"?
fyi Ever notice how scientists who test Relativity or any other Theory in the Universe apart from “American CO2 is killing all life on Earth” are not “Deniers”
 
fyi Ever notice how scientists who test Relativity or any other Theory in the Universe apart from “American CO2 is killing all life on Earth” are not “Deniers”
I didn't say "deniers". I said "global warming deniers".


You ever wonder why AGW Cult deals in anomalies and not actual temperatures ?

It’s because actual temperatures are DENIERS and must get adjusted and glossed over to make AGW work at all

Sabine was booted from the Global Warming Club for asking too many questions, also invalidating the 97% agree fiction

Sabine Hossenfelder is a discredited climate quack with no experience or published science in any climate science field.

That's why she is making monetized youtube videos to fool gullible peole, instead of publishing science.

As the deniers love to say: follow the money.
 
Just as an FYI, the authors of this paper are a who's who of global warming deniers.

Why the large difference between the left and right data for "Sun and volcanoes only"?
No. They are deniers of AGW. So what? So am I.

Their paper showed the planet is naturally warming. Which is what I have been arguing. The difference is their model and the models used by the IPCC is that their model used NASA's high variability solar output dataset instead of the low variability dataset and excluded urban temperature stations which are affected by the urban heat effect.

And don't get me started on the IPCC model's other flaws because they are significant.
 
I didn't say "deniers". I said "global warming deniers".


"Global Warming deniers"

1. satellites and balloons, which refused to show "warming" in the atmosphere despite rising Co2
2. hurricanes, which have refused to break out despite the "warming" of the oceans
3. ocean level, which has not gone up despite "ongoing net ice melt"
4. Surface Air Pressure, which is dropping over the past 70 years despite "ongoing net ice melt"


The instruments are all "deniers."
 
"Global Warming deniers"

1. satellites and balloons, which refused to show "warming" in the atmosphere despite rising Co2
One segment of satellilte and one segment of radiosonde data that did not match other data at the time and were found to both be suffering calibration issues. Data before, during and after their collection showed warming.
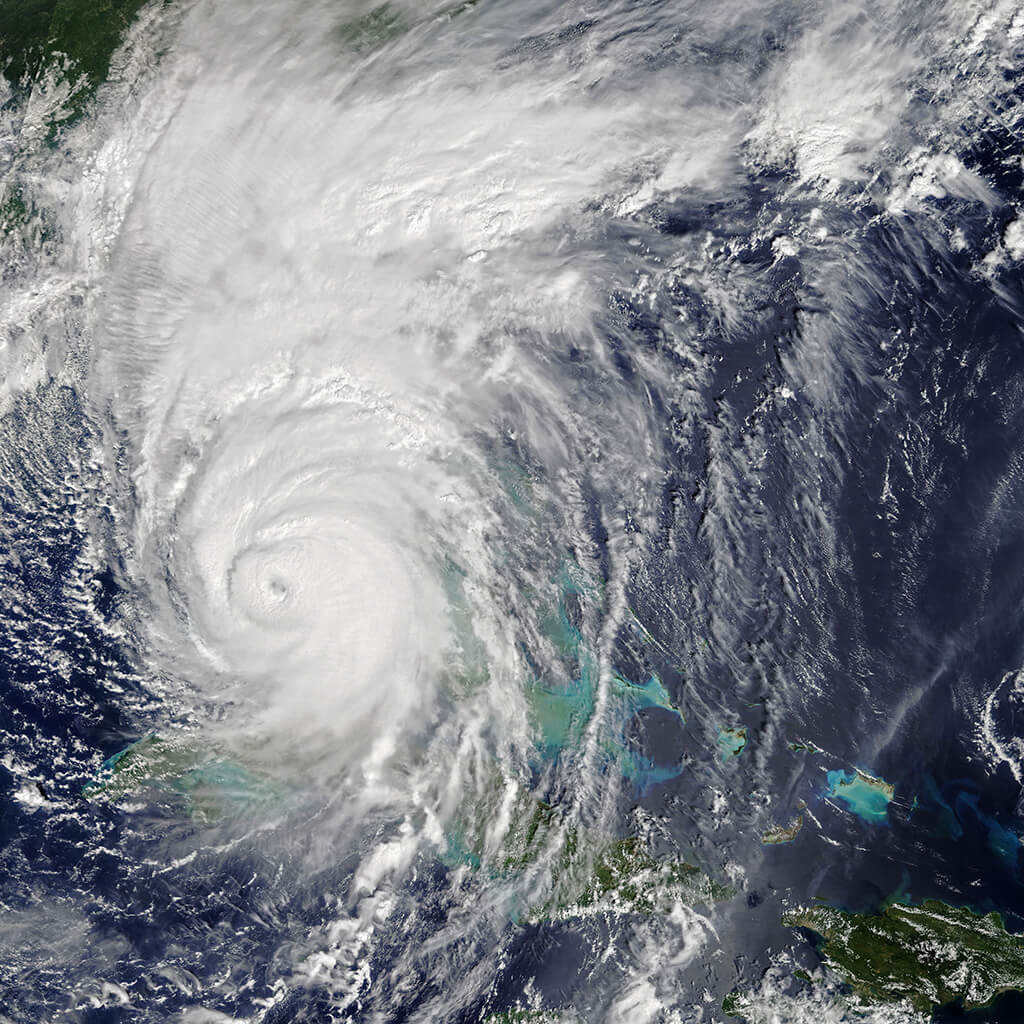
2. hurricanes, which have refused to break out despite the "warming" of the oceans
You always use the term "break out". Let's try a more quantifiable term: INCREASE


ACCUMULATED CYCLONE ENERGY INDEX v TIME
1723901951447.png


ATLANTIC HURRICANE STORM COUNT v TIME


1723902022468.png


POWER DISSIPATION INDEX v TIME
1723902043672.png


CHANGE IN POWER DISSIPATION INDEX v TIME

1723902082560.png

3. ocean level, which has not gone up despite "ongoing net ice melt"​


GLOBAL LAND-BASED ICE MASS BALANCE v TIME

1723902260089.png


ARCTIC SEA ICE VOLUME v TIME
1723902320859.png


GLOBAL SEA LEVEL v TIME
1723902720308.png

4. Surface Air Pressure, which is dropping over the past 70 years despite "ongoing net ice melt"
As several people have already told you, surface pressure drops with increasing temperature.
The instruments are all "deniers."
'You are entitled to your opinion. But you are not entitled to your own facts.' --Daniel Patrick Moynihan
 
  • Informative
Reactions: cnm
that did not match other data at the time


LOL!

Did not match Urban Heat Island Effect, the only warming your side has ever had from actual data.

You have NO DATA showing warming IN THE ATMOSPHERE WHERE THE Co2 IS....


You always use the term "break out". Let's try a more quantifiable term: INCREASE


A buttload of color fudge charts... who needs THE ACTUAL HURRICANE DATA showing 1940s as strongest ever decade, second place to the 1890s...


Your side claims "ocean warming." Hurricane data says YOU ARE FULL OF SHIT AS USUAL....
 
surface pressure drops with increasing temperature.


LOL

Over 70 years or 7 minutes...?? Citing daily "warm air rises" BS doesn't explain 70 years, dipshit....

We have a 70 year decline in SAP during a time where YOUR SIDE claims there is an ONGOING NET ICE MELT....

SAP refutes that. If there were an ongoing net ice melt, SAP would be increasing, but it isn't.
And now is when everyone else is supposed to scramble to dispel your lies.

Sorry. Nobody has to do that. You're an uneducated internet rando slob. Nobody cares.
 

New Topics

Back
Top Bottom