RollingThunder
Gold Member
- Mar 22, 2010
- 4,818
- 525
- 155
Another denier cult myth and their favorite 'talking point' gets thoroughly destroyed by science. One of the denier cult dingbats was so confused and misled, he actually started a thread called: "Satellite Data Shows No Global Warming For Nearly 19 Years", which is total denier cult horseshit.
As Dr. Romm, one of the world's top climate scientists, observed: "In fact, for those who live in reality, as opposed to in denial, satellite data, ground-based weather stations, sea-based buoys, and even weather balloons all reveal a steady long-term warming trend."
Here's what the science is actually telling us.
Climate Deniers’ Favorite Temperature Dataset Just Confirmed Global Warming
Dr. Joe Romm
Mar 2, 2016
CREDIT: ROY SPENCER, UNIVERSITY OF ALABAMA AT HUNTSVILLE
February smashed monthly global temperature records, according to the satellite data analyzed by the University of Alabama at Huntsville (UAH). At the same time, a brand new study concludes that miscalculations explain why the Remote Sensing Systems (RSS) satellite temperature dataset had appeared to show a relatively slow rate of global warming.
So Ted Cruz and his fellow climate science deniers need a new meme to replace their “satellites find no warming since 1998” talking point, which replaced the “there’s been no warming since 1998” talking point after that one fell apart when 2014 became the hottest year on record — and again when 2015 blew away the 2014 record.
In fact, for those who live in reality, as opposed to in denial, satellite data, ground-based weather stations, sea-based buoys, and even weather balloons all reveal a steady long-term warming trend.
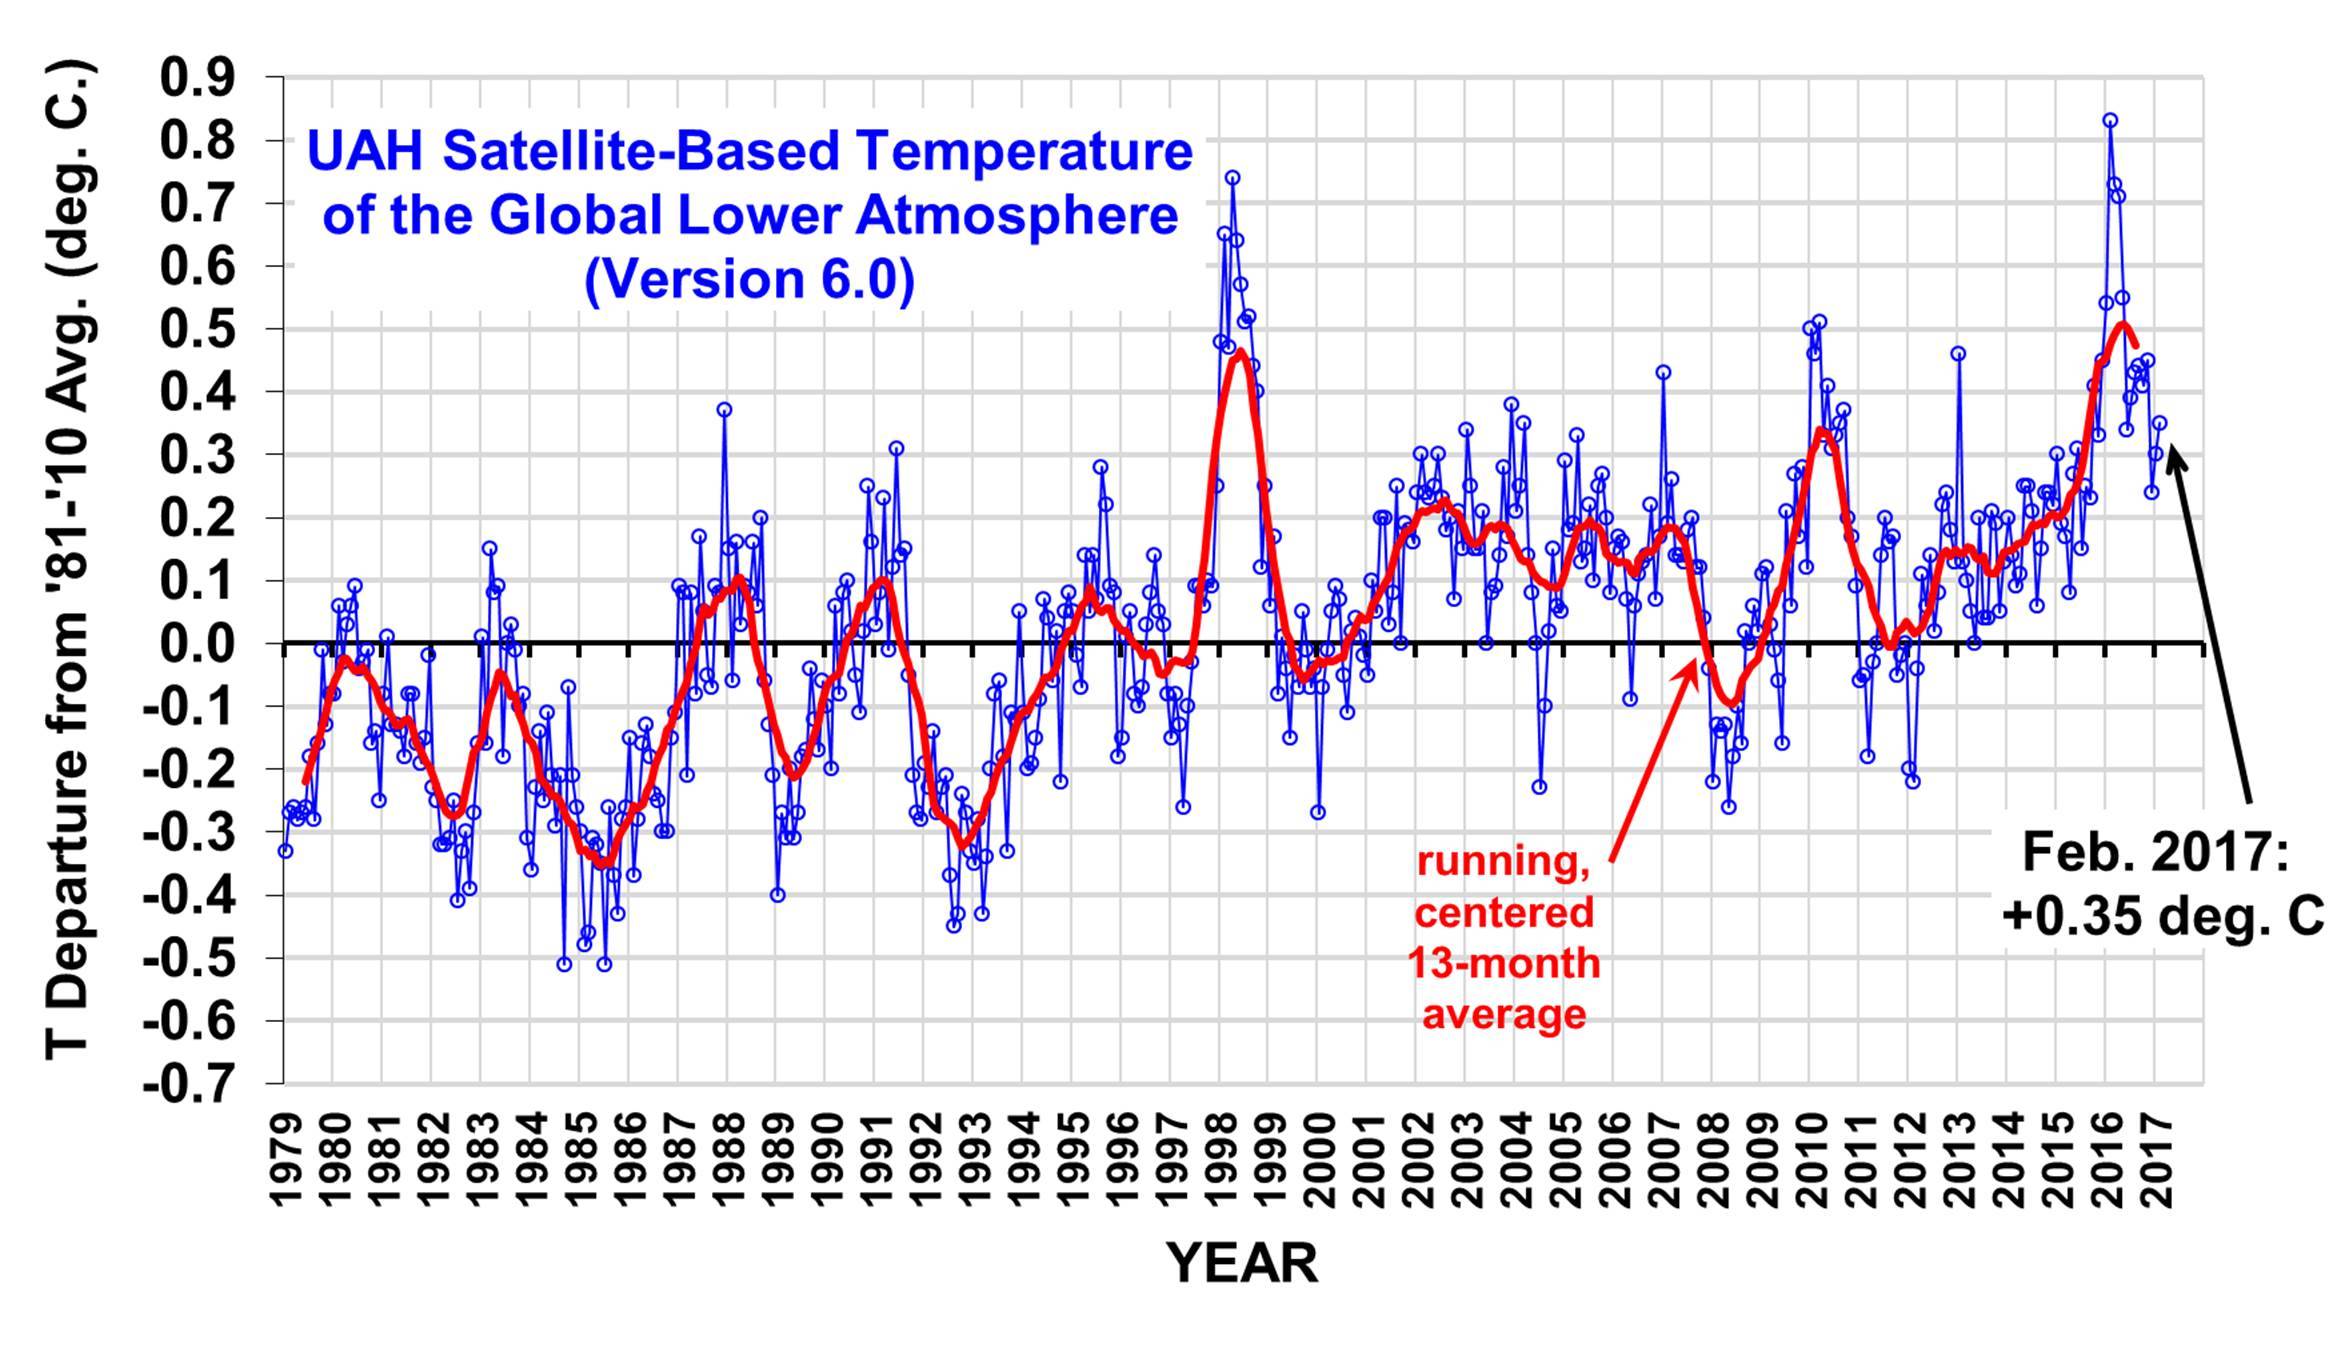
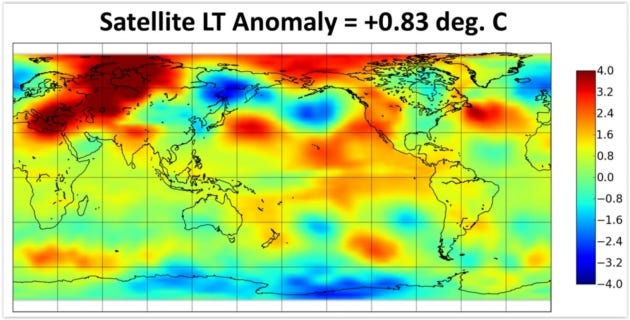
Let’s start with the UAH data, which show a stunning 1.5°F (0.83°C) warming in February 2016 compared to the historical (1981–2010) average for the lower troposphere (the lowest part of the atmosphere):
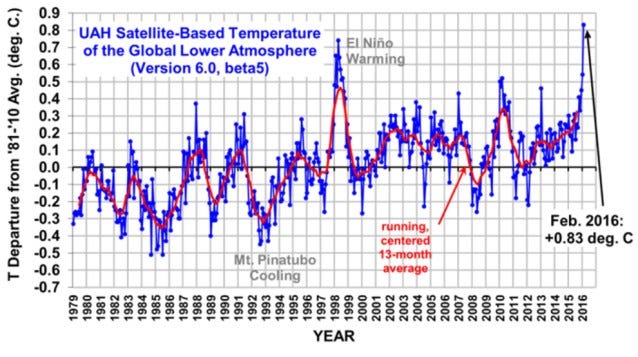
The lower tropospheric temperature (LT) anomaly, via UAH scientist Roy Spencer.
How amazing is this temperature jump? First off, remember that the 1981–2010 baseline used by the UAH is itself some 0.8°F (0.45°C) hotter than pre-industrial levels — so you can add that to all of the numbers here.
Second, February was more than half a degree Fahrenheit — 0.52°F (0.29°C) — warmer than January, which itself was “the warmest January in satellite record.”
Third, it was so hot last month that Dr. Roy Spencer of the UAH reports, “Incredibly, land areas outside the tropics in the Northern Hemisphere were a ‘whopping’ 1.46 degrees C above average, 0.5 degrees above any previous monthly anomaly.” This is a 2.6°F warming above the 1981–2010 average — topping the previous anomaly by 0.9°F.
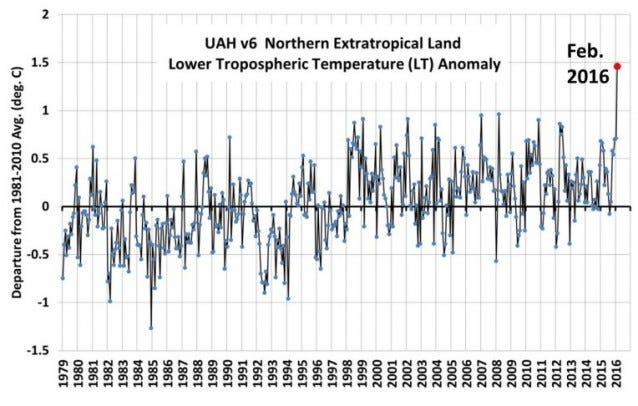
Lower atmospheric warming over land outside of the tropics (vs. the 1981–2020 average) via UAH scientist Roy Spencer.
Fourth, it was so hot last month that Spencer — one of country’s leading climate science deniers — told the Washington Post:
"I’ve always cautioned fellow skeptics that it’s dangerous to claim no warming. There has been warming. The question is how much warming there’s been and how does that compare to what’s expected and what’s predicted."
Now we know there has been a lot of warming, it’s consistent with what scientists predicted, and, most worrisome of all, scientists now predict it will keep speeding up! Maybe we should start listening to them.
I’m sure you’ve heard from Ted Cruz and other climate science deniers that there hasn’t been any warming in the satellite record since 1998. What they really meant was there was not as much warming as expected in the lower troposphere in the (questionable) RSS data.
The UAH’s Spencer and Dr. John Christy — both leading deniers — reported just last month that the UAH data shows a “Global climate trend since Nov. 16, 1978 [of] +0.12 C [0.22F] per decade.”
In fact out of all the temperature datasets — land, sea, weather balloons, and two from satellites (UAH and RSS) — only one dataset had shown unexpectedly slow warming in recent years, the RSS data. Unsurprisingly, that is the dataset deniers like Ted Cruz have glommed on to — despite the fact that it was widely believed the RSS data was being misanlayzed.
Indeed, back in 2011, Spencer himself explained the discrepancy between the UAH data and the RSS data on his website: “my UAH cohort and boss John Christy, who does the detailed matching between satellites, is pretty convinced that the RSS data is undergoing spurious cooling because RSS is still using the old NOAA-15 satellite which has a decaying orbit, to which they are then applying a diurnal cycle drift correction based upon a climate model, which does not quite match reality.”
The drift correction is needed because different parts of the planet are observed by satellites at different times during the day — and because satellites drift from orbit to orbit. Spencer adds that the UAH data is probably better because “We have not used NOAA-15 for trend information in years…we use the NASA Aqua AMSU [advanced microwave sounding unit], since that satellite carries extra fuel to maintain a precise orbit.”
Since Spencer is a leading climate science denier, however, he did not urge his fellow deniers to avoid using the likely flawed RSS data. Quite the reverse:
But, until the discrepancy is resolved to everyone’s satisfaction, those of you who REALLY REALLY need the global temperature record to show as little warming as possible might want to consider jumping ship, and switch from the UAH to RSS dataset.
Seriously! Spencer is such a gung-ho denier of climate science he is telling his fellow deniers who want to minimize the reality of global warming that they should not use his own data set, which he and Christy believes is superior, but instead they should use the RSS data, which they believe had a flawed diurnal cycle drift correction.
So only hard-core climate science deniers should be surprised to learn that the new study in the Journal of Climate by members of the RSS team finds that the … wait for it … the RSS data had been low-balling recent global warming because of a flawed diurnal cycle drift correction. That study, aptly titled, “Sensitivity of satellite-derived tropospheric temperature trends to the diurnal cycle adjustment,” concluded, “Previous versions of the RSS dataset have used a diurnal climatology derived from general circulation model output to remove the effects of drifting local measurement time. In this paper, we present evidence that this previous method is not sufficiently accurate, and present several alternative methods to optimize these adjustments using information from the satellite measurements themselves.”
The researchers then use an improved and optimized adjustments methodology and report:
The new dataset shows substantially increased global-scale warming relative to the previous version of the dataset, particularly after 1998. The new dataset shows more warming than most other middle tropospheric data records constructed from the same set of satellites. We also show that the new dataset is consistent with long-term changes in total column water vapor over the tropical oceans, lending support to its long-term accuracy.
In short, once a long-standing analytical error was fixed, the RSS data showed long-term global warming comparable to UAH. Here is the result:
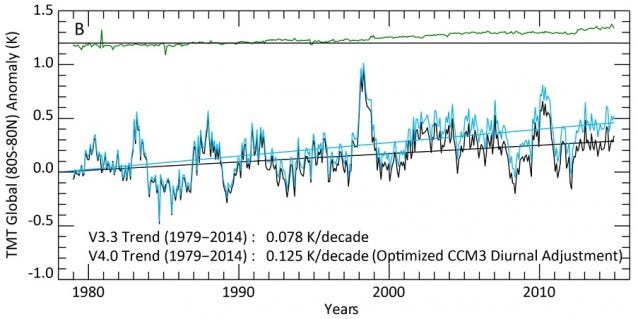
Comparison between previous, flawed RSS global (80°S to 80°N) anomaly time series (V3.3, black line), with results using a more accurate methodology (V4.0, blue line).
The corrected dataset shows a 0.125°C [0.225°F] rate of warming per decade from 1979 to 2014. The corrected trend is 60 percent higher than the earlier, flawed rate of warming.
For those wondering why the satellite trends are slightly lower than the surface temperature trends, which exceed 0.16°C (0.29°F) per decade — and rising: It is always worth remembering that the surface temperature data directly measures the temperature at the surface where we live. The satellites indirectly measure the temperature of the lower atmosphere, where we don’t. Also, given that 2016 is likely to be the hottest year in the satellite record, the satellite trend — like the surface temperature trend — appears to be speeding up.
The phantom slowdown in the last of the big global temperature datasets is gone. The reality is that the globe has warmed and will continue to warm — primarily because of human-caused carbon pollution — as climate scientists have been saying for decades.
No doubt the climate science deniers will find another talking point to urge delay. But it is time for the rest of us to redouble our efforts to preserve a livable climate.
As Dr. Romm, one of the world's top climate scientists, observed: "In fact, for those who live in reality, as opposed to in denial, satellite data, ground-based weather stations, sea-based buoys, and even weather balloons all reveal a steady long-term warming trend."
Here's what the science is actually telling us.
Climate Deniers’ Favorite Temperature Dataset Just Confirmed Global Warming
Dr. Joe Romm
Mar 2, 2016
CREDIT: ROY SPENCER, UNIVERSITY OF ALABAMA AT HUNTSVILLE
February smashed monthly global temperature records, according to the satellite data analyzed by the University of Alabama at Huntsville (UAH). At the same time, a brand new study concludes that miscalculations explain why the Remote Sensing Systems (RSS) satellite temperature dataset had appeared to show a relatively slow rate of global warming.
So Ted Cruz and his fellow climate science deniers need a new meme to replace their “satellites find no warming since 1998” talking point, which replaced the “there’s been no warming since 1998” talking point after that one fell apart when 2014 became the hottest year on record — and again when 2015 blew away the 2014 record.
In fact, for those who live in reality, as opposed to in denial, satellite data, ground-based weather stations, sea-based buoys, and even weather balloons all reveal a steady long-term warming trend.
Let’s start with the UAH data, which show a stunning 1.5°F (0.83°C) warming in February 2016 compared to the historical (1981–2010) average for the lower troposphere (the lowest part of the atmosphere):
The lower tropospheric temperature (LT) anomaly, via UAH scientist Roy Spencer.
How amazing is this temperature jump? First off, remember that the 1981–2010 baseline used by the UAH is itself some 0.8°F (0.45°C) hotter than pre-industrial levels — so you can add that to all of the numbers here.
Second, February was more than half a degree Fahrenheit — 0.52°F (0.29°C) — warmer than January, which itself was “the warmest January in satellite record.”
Third, it was so hot last month that Dr. Roy Spencer of the UAH reports, “Incredibly, land areas outside the tropics in the Northern Hemisphere were a ‘whopping’ 1.46 degrees C above average, 0.5 degrees above any previous monthly anomaly.” This is a 2.6°F warming above the 1981–2010 average — topping the previous anomaly by 0.9°F.
Lower atmospheric warming over land outside of the tropics (vs. the 1981–2020 average) via UAH scientist Roy Spencer.
Fourth, it was so hot last month that Spencer — one of country’s leading climate science deniers — told the Washington Post:
"I’ve always cautioned fellow skeptics that it’s dangerous to claim no warming. There has been warming. The question is how much warming there’s been and how does that compare to what’s expected and what’s predicted."
Now we know there has been a lot of warming, it’s consistent with what scientists predicted, and, most worrisome of all, scientists now predict it will keep speeding up! Maybe we should start listening to them.
I’m sure you’ve heard from Ted Cruz and other climate science deniers that there hasn’t been any warming in the satellite record since 1998. What they really meant was there was not as much warming as expected in the lower troposphere in the (questionable) RSS data.
The UAH’s Spencer and Dr. John Christy — both leading deniers — reported just last month that the UAH data shows a “Global climate trend since Nov. 16, 1978 [of] +0.12 C [0.22F] per decade.”
In fact out of all the temperature datasets — land, sea, weather balloons, and two from satellites (UAH and RSS) — only one dataset had shown unexpectedly slow warming in recent years, the RSS data. Unsurprisingly, that is the dataset deniers like Ted Cruz have glommed on to — despite the fact that it was widely believed the RSS data was being misanlayzed.
Indeed, back in 2011, Spencer himself explained the discrepancy between the UAH data and the RSS data on his website: “my UAH cohort and boss John Christy, who does the detailed matching between satellites, is pretty convinced that the RSS data is undergoing spurious cooling because RSS is still using the old NOAA-15 satellite which has a decaying orbit, to which they are then applying a diurnal cycle drift correction based upon a climate model, which does not quite match reality.”
The drift correction is needed because different parts of the planet are observed by satellites at different times during the day — and because satellites drift from orbit to orbit. Spencer adds that the UAH data is probably better because “We have not used NOAA-15 for trend information in years…we use the NASA Aqua AMSU [advanced microwave sounding unit], since that satellite carries extra fuel to maintain a precise orbit.”
Since Spencer is a leading climate science denier, however, he did not urge his fellow deniers to avoid using the likely flawed RSS data. Quite the reverse:
But, until the discrepancy is resolved to everyone’s satisfaction, those of you who REALLY REALLY need the global temperature record to show as little warming as possible might want to consider jumping ship, and switch from the UAH to RSS dataset.
Seriously! Spencer is such a gung-ho denier of climate science he is telling his fellow deniers who want to minimize the reality of global warming that they should not use his own data set, which he and Christy believes is superior, but instead they should use the RSS data, which they believe had a flawed diurnal cycle drift correction.
So only hard-core climate science deniers should be surprised to learn that the new study in the Journal of Climate by members of the RSS team finds that the … wait for it … the RSS data had been low-balling recent global warming because of a flawed diurnal cycle drift correction. That study, aptly titled, “Sensitivity of satellite-derived tropospheric temperature trends to the diurnal cycle adjustment,” concluded, “Previous versions of the RSS dataset have used a diurnal climatology derived from general circulation model output to remove the effects of drifting local measurement time. In this paper, we present evidence that this previous method is not sufficiently accurate, and present several alternative methods to optimize these adjustments using information from the satellite measurements themselves.”
The researchers then use an improved and optimized adjustments methodology and report:
The new dataset shows substantially increased global-scale warming relative to the previous version of the dataset, particularly after 1998. The new dataset shows more warming than most other middle tropospheric data records constructed from the same set of satellites. We also show that the new dataset is consistent with long-term changes in total column water vapor over the tropical oceans, lending support to its long-term accuracy.
In short, once a long-standing analytical error was fixed, the RSS data showed long-term global warming comparable to UAH. Here is the result:
Comparison between previous, flawed RSS global (80°S to 80°N) anomaly time series (V3.3, black line), with results using a more accurate methodology (V4.0, blue line).
The corrected dataset shows a 0.125°C [0.225°F] rate of warming per decade from 1979 to 2014. The corrected trend is 60 percent higher than the earlier, flawed rate of warming.
For those wondering why the satellite trends are slightly lower than the surface temperature trends, which exceed 0.16°C (0.29°F) per decade — and rising: It is always worth remembering that the surface temperature data directly measures the temperature at the surface where we live. The satellites indirectly measure the temperature of the lower atmosphere, where we don’t. Also, given that 2016 is likely to be the hottest year in the satellite record, the satellite trend — like the surface temperature trend — appears to be speeding up.
The phantom slowdown in the last of the big global temperature datasets is gone. The reality is that the globe has warmed and will continue to warm — primarily because of human-caused carbon pollution — as climate scientists have been saying for decades.
No doubt the climate science deniers will find another talking point to urge delay. But it is time for the rest of us to redouble our efforts to preserve a livable climate.