What is the general trend for surface temps over the past 8 years or so?
Calculating trends over such a short time period is pointless due to the 'noise' of the natural variations, as you would know if you actually knew anything about science and weren't just another clueless dupe parroting denier cult propaganda.
Are they anywhere CLOSE to the acceleration and slope of the 90s?
Due to natural factors that affect the climate (that have been discussed many times here but that you still manage to ignore) like the extended low solar minimum and the multiple La Nina years, this last decade or so has seen a slight slowdown in the rising surface temperature trend. So what? That kind of decadal variation is exactly what the climate models have predicted and observations have confirmed. The last decade was still the warmest decade in the entire instrumental record going back to 1860. Almost all of the top ten warmest years on record occurred in the last decade. Even more important, scientists have found that as the Earth continues to retain more of the radiative heat energy it receives from the sun than it is able to radiate back into space, a good deal of that heat energy has been going into the oceans. Here is the real temperature trend line for both the land surface and the oceans.
Why don't you give me the rate and acceleration for say 2000 to 2011....
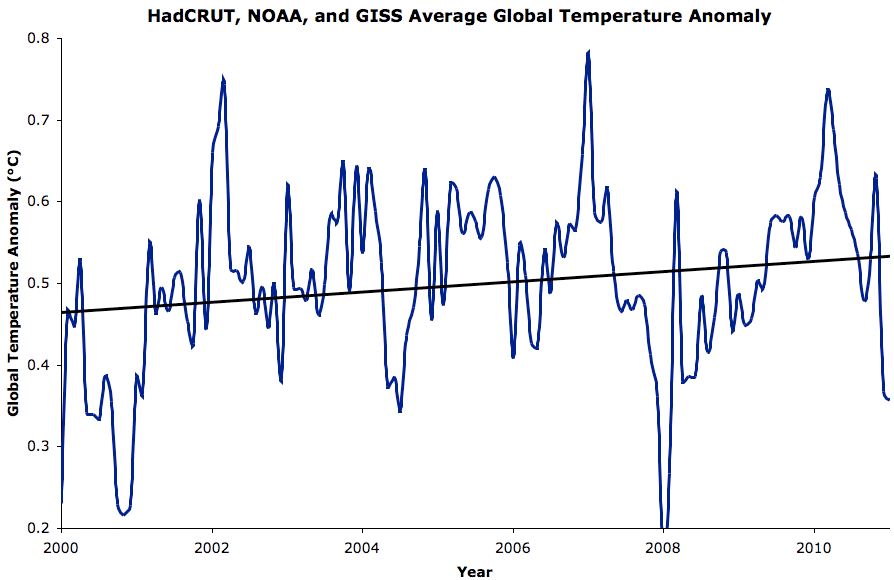
Why don't we look at it in the larger context that actually conveys the definite upward direction of the long term trend and demonstrates that the decade to decade variability due to natural factors doesn't affect the long term underlying trend.
If you don't recognize that my statement was COMPLETELY CORRECT
It is only in your deluded little fantasy world that your retarded drivel ("
statements") is ever "
COMPLETELY CORRECT", you flaming moron.
I lifted this from a local Warmer Church site so I wouldn't have to listen to spoiled whining..
Look familiar?
Yeah, retard, it shows the rising temperature trend from 2000 to 2011 and also demonstrates the year to year ups and downs induced by the play of natural variability. The anthropogenic greenhouse gas forcing is overwhelming all of the up and down natural variations and pushing the longer term temperature trend steadily upwards. Temperatures were rising even though there was a very deep and extended solar minimum over most of the decade. The previous solar cycle peaked around the beginning of the decade and then went into a decline and extended minimum that lasted until 2011. As solar cycle 24 heads for its maximum next year, we will almost certainly see new record high temperatures as natural variability adds to the rising temperature trend rather than diminishing it.
Mann says that rate is "not statistically significant"..
Dr. Mann never said any such thing, you lying POS. You don't even understand what 'statistically significant' means, retard, or just how it differs from simply 'significant'.
You may be dredging up some old distorted memory of one of the fossil fuel industry's propaganda memes from 2010 when a reporter asked Prof. Phil Jones of the CRU if the warming trend from 1995 to then was "statistically significant". Prof. Jones explained to him that such small time periods weren't very useful for gauging long term trends. He said that the trend was very close to statistical significance, maybe 90%, but that it didn't quite achieve the arbitrary 95% confidence level that defines 'statistical significance' - yet. Of course his words were seized on and distorted by the fossil fuel industry propagandists and their easily confused denier cult dupes. But guess what, fecalbrain???
Global warming since 1995 'now significant'
BBC News
By Richard Black - Environment correspondent
10 June 2011
(excerpts)
Climate warming since 1995 is now statistically significant, according to Phil Jones...Last year, he told BBC News that post-1995 warming was not [statistically] significant - a statement still seen on blogs critical of the idea of man-made climate change. But another year of data has pushed the trend past the threshold usually used to assess whether trends are "real". Dr Jones says this shows the importance of using longer records for analysis.
By widespread convention, scientists use a minimum threshold of 95% to assess whether a trend is likely to be down to an underlying cause, rather than emerging by chance. If a trend meets the 95% threshold, it basically means that the odds of it being down to chance are less than one in 20. Last year's analysis, which went to 2009, did not reach this threshold; but adding data for 2010 takes it over the line. "The trend over the period 1995-2009 was significant at the 90% level, but wasn't significant at the standard 95% level that people use," Professor Jones told BBC News. "Basically what's changed is one more year [of data]. That period 1995-2009 was just 15 years - and because of the uncertainty in estimating trends over short periods, an extra year has made that trend significant at the 95% level which is the traditional threshold that statisticians have used for many years. "It just shows the difficulty of achieving significance with a short time series, and that's why longer series - 20 or 30 years - would be a much better way of estimating trends and getting significance on a consistent basis." Professor Jones' previous comment, from a BBC interview in Febuary 2010, is routinely quoted - erroneously - as demonstration that the Earth's surface temperature is not rising.