Interesting active graphic there. The scale changes so that the top of the list never appears to change. Here are a few other ways to look at CO2 data:
(from the same org as yours)
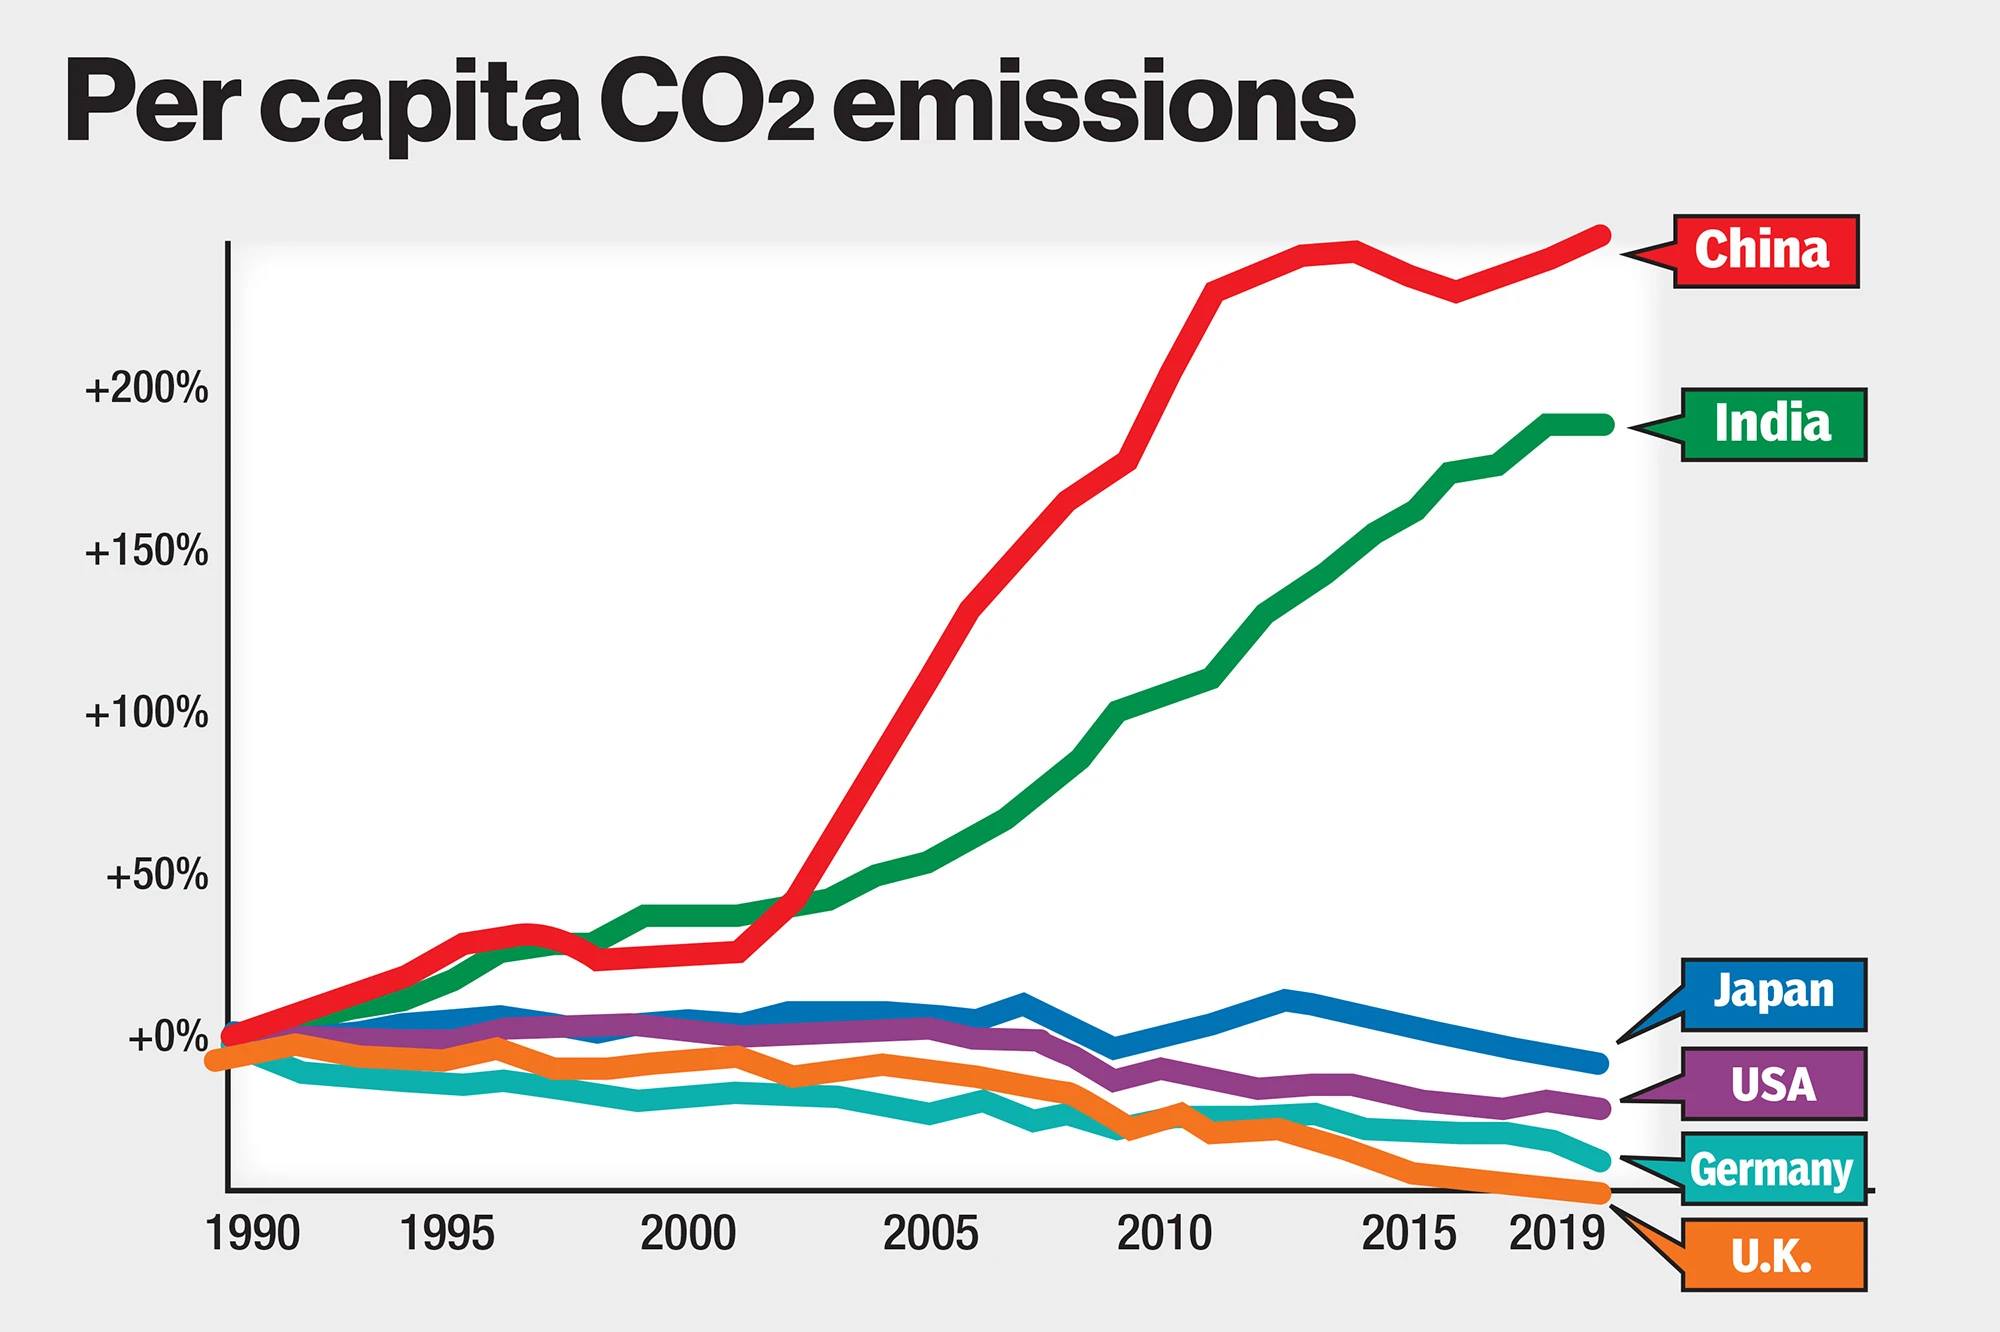
You should like this one
Are China and India wildly outpacing the U.S., United Kingdom, Germany and Japan on emissions of carbon dioxide? A chart

www.politifact.com
This came from a PolitiFact Fact Check and was rated "Half-True". Note the vertical scale here. China and India in the last century were third world nations with CO2 emissions a tiny fraction of US emissions. Since then, both have modernized (read added enormous numbers of motor vehicles and homes with heating and AC) and industrialized. At the 1990 line, where the graph seems to show them all equal, the US was putting out 6.6 times the CO2 of China. So, each of those bars actually has its own absolute scale.
When your graph ends in 2020, China is producing 2,912 MT CO2 per year versus the US's 1,286 MT; 226% greater.
However when the graph began, China was producing 125 MT while the US produced 813 MT, a 650% lead. And China didn't cross the US till 2008. Regarding who is more responsible for global warming, you need to take into account that very long lifespan of CO2 in the atmosphere. Virtually every shred of CO2 emitted since 1850 is still present. So, let's compare those numbers.
How to reduce global carbon dioxide (CO2) emissions will be a major topic at the upcoming COP27 United Nations climate summit in Egypt next week.

www.reuters.com
Obviously, the world needs everyone, including both China, the US and all the other major emitters, to act as rapidly as they can to reduce and eventually end CO2 emissions. However, this constant effort to say "if China won't do it, we shouldn't do it" is precisely characterized by the analogy someone posted here in the last couple of days about two guys in a sinking boat. When one stops bailing, the other says "well, if you're not going to bail, I'm not either" If you do not see that and what that actually portends for the human future on this planet, you have allowed your biases and preconceptions to render your judgement that of a two year old.


/cloudfront-us-east-2.images.arcpublishing.com/reuters/ESE2IG2RYFLT5JAFPAPDXAGNSU.jpg)