Brazilian Heatwave

You sure do a lot of back pedaling for all your supposed academic prowess.
I have a BSc in ocean engineering. That's not a claim to academic prowess. What is probably noteworthy to you is that I admit my mistakes. Sadly, that's not a common practice among posters here. I'll turn 70 in a bit and, as they say, memory's the first thing to go.
 
I have a BSc in ocean engineering. That's not a claim to academic prowess. What is probably noteworthy to you is that I admit my mistakes. Sadly, that's not a common practice among posters here. I'll turn 70 in a bit and, as they say, memory's the first thing to go.
or in your case, rationality went first
 

July 4 Was Earth's Hottest Day In Over 100000 Years ...

Forbes
https://www.forbes.com › maryroeloffs › 2023/07/05

Jul 5, 2023 — Scientists say July 4 could have been the hottest day on Earth in as many as 125000 years.

Earth is at its hottest in thousands of years. Here's how we ...

Washington Post
https://www.washingtonpost.com › 2023/07/08 › earth...

Jul 8, 2023 — Scientists are confident that, apart from the global warming of recent decades, it was Earth's warmest period in the past 100,000 years. They ...

July 2023 Is Hottest Month Ever Recorded on Earth

Scientific American
https://www.scientificamerican.com › article › july-20...

Jul 27, 2023 — This July is set to be the hottest month ever recorded on Earth—and likely the hottest in about 120,000 years—preliminary analyses show.

Climate change: 2023 likely to be the hottest in 100000 years

Sydney Morning Herald
https://www.smh.com.au › ... › Climate crisis
Oct 25, 2023 — June, July, August, September and (very probably) October were the warmest respective months since records began. A strong El Nino is expected ..

`
So you are saying everything is perfectly normal for an interglacial period?
 
So you are saying everything is perfectly normal for an interglacial period?

Marcott and the Death of Dishonest Drone Ding's "normal interglacial"
1700440748281.png


Note the AGW SPIKE on the upper Right/last 200 years that is distinctly UNnatural in the rest of the 12,000 years.

`
 
Last edited:
Marcott and the Death of Dishonest Drone Ding's "normal interglacial"
1700440748281.png


Note the AGW SPIKE on the upper Right/last 200 years that is distinctly UNnatural in the rest of the 12,000 years.

`
Great graph. It shows the warming started 150 years before CO2 could cause it.

Also that's a much more honest zero line than the IPCC uses.
 
Great graph. It shows the warming started 150 years before CO2 could cause it.

Also that's a much more honest zero line than the IPCC uses.
Perfect!
Thank for quoting my post/graph.
Everyone please note the portion of the graph that is Visible on Ding's quote above.
ONLY THE UPPER RIGHT SPIKE/Last 150-200 years.
IOW, the Hottest.
He unwittingly used the lower Straight edge of the quote border to eliminate the cooler 11,800 years!


`
 
Last edited:
Perfect!
Thank for quoting my post/graph.
Everyone please note the portion of the graph is Visible on Ding's quote above.
ONLY THE UPPER RIGHT SPIKE/Last 150-200 years.
IOW, the Hottest.
He unwittingly used the lower Straight edge of the quote border to eliminate the cooler 11,800 years!


`

Wow!
1 degree.
The last time temperatures increased 1 degree, everything died.
DURR
 
Perfect!
Thank for quoting my post/graph.
Everyone please note the portion of the graph that is Visible on Ding's quote above.
ONLY THE UPPER RIGHT SPIKE/Last 150-200 years.
IOW, the Hottest.
He unwittingly used the lower Straight edge of the quote border to eliminate the cooler 11,800 years!


`
Great graph. It shows the warming started 150 years before CO2 could cause it.

Also that's a much more honest zero line than the IPCC uses.

This chart agrees with what Kobashi et al. (2011) found. That warmer temperatures were the norm in the earlier part of the past 4,000 years, including century-long intervals nearly 1°C warmer than the decade (2001-2010). Therefore, it appears that the current decadal mean temperature in Greenland has not exceeded the envelope of natural variability over the past 4,000 years.

This chart agree with what Schönwiese (1995) found that during the past 10,000 years temperatures over long periods were higher than they are today. The warmest phase occurred 4,000 to 8,000 years ago and is known as the Holocene Climate Optimum or the Atlantic Period..."
 
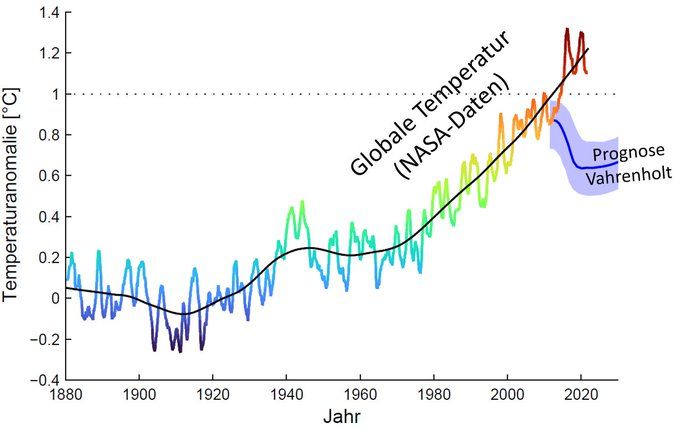
Great graph. It shows[size=3 [COLOR=rgb(226, 80, 65) [size=3]the warming started 150 years before CO2 could cause it.[/SIZE]

Also that's a much more honest zero line than the IPCC uses.

This chart agrees with what Kobashi et al. (2011) found. That warmer temperatures were the norm in the earlier part of the past 4,000 years, including century-long intervals nearly 1°C warmer than the decade (2001-2010). Therefore, it appears that the current decadal mean temperature in Greenland has not exceeded the envelope of natural variability over the past 4,000 years.


This chart agree with what Schönwiese (1995) found that during the past 10,000 years temperatures over long periods were higher than they are today. The warmest phase occurred 4,000 to 8,000 years ago and is known as the Holocene Climate Optimum or the Atlantic Period..."


I refute EVERYTHING you try.
While you just REPEAT LIES.
Where is Busted 'Repetition' in your Triange of Virtue you mentally ill little Hypocrite?


Climate Denial Published by Statistics Norway

A discussion paper released by Statistics Norway contains standard talking-points of climate denial and a crude statistical model of selected temperature measurements which is unable to detect anything. Here I show how these points are flawed and point to sources of facts and scientific findings.

Sep 30, 2023 •
A preprint posted on the website of Statistics Norway gave climate deniers the platform to spread Lies about how climate research works and promote conspiracy theories in an interview with one of the country's largest newspapers, Dagbladet.

It is very surprising that the agency entrusted with the offical statistics, Statistics Norway, has published the manuscript “To what extent are temperature levels changing due to greenhouse gas emissions?” by Dagsvik and Moen, given the dubious content and character of that work. Statistics Norway says it is normal practice in social science to release preprints of scientific work, but their release gives this manuscript the impemature of peer-reviewed and officially approved information. However, the argument that the agency had no choice but to release work that one of their (retired) scientists was involved in, does not hold. The manuscript does not constitute a research paper but a piece of propaganda. The agency does not publish anybody else's opinion pieces.

It should be easy for Statistics Norway to recognize that it is not a scientific manuscript given the following characteristics:

* Since Isaac Newton’s famous dictum ‘I stand on the shoulder of giants’, it has been a standard scientific practice to review prior work in the same domain before presenting one’s own work. The manuscript does not contain such a review.
Given their question, the authors would otherwise have had to account for the chapter ‘The Human Influence on the Climate System’ of the latest IPCC report, which on 100 pages provides a very thorough treatment of the matter. That assessment is based on the full body of scientific work, and just the list of sources used fills 30 pages.

* Instead of reviewing prior analyses of temperature trends and their connection to greenhouse gas concentrations, Dagsvik and Moen promote several alternative, false theories, as well as assertions and remarks that are irrelevant to the matter at hand.

* The report repeats several points from the book 'the cold sun' by German ex-politician Fritz Vahrenholt, published in 2012, which promoted the theory that the solar cycle determines the climate of the Earth. The book was characterized by a biased presentation of the literature, where several sources were misquoted. Vahrenholt further concluded with certainty that the temperature up to 2020 and beyond would drop. Haven't Dagsvik and Moen realised that the opposite has happened?

Prognose_KalteSonne.jpg
Prognosis of global temperatures in "the cold sun" and actual development. Figure credit: Stefan Rahmstorf

* Dagsvik and co-author Moen further cite astrophysicist Henrik Svensmark's theory that cosmic rays through processes in the upper atmosphere affect the climate on Earth. The theory was tested in climate research's most expensive experiment, at CERN about 10 years ago. The experiment showed that the mechanism described by Svensmark was too weak to affect the temperature of the earth's surface. It is surprising that Statistics Norway cites old theories that have been tested and rejected.

image.png
Summary of the 2016 paper in Science on the results of the CLOUD experiment which tested Henrik Svensmark's theory of cloud formation and its impact on the global climate.

* Retired economist Dagsvik asserts that atmospheric physicists do not understand that the weather is chaotic. In fact, atmospheric physicists teach this in their introductory courses. They also understand fundamental fluid dynamics and have developed an approach to solve fluid-dynamic equations for an open system. It is inappropriate for a scientific manuscript to contain disparaging assertions about other, far-removed disciplines and fields of study.

Have temperatures increased?

image-1.png
Frequency of extreme temperatures: a Percent of the global land area with monthly temperatures above different sigma-thresholds in any calendar month (averaged over the year). Sigma is the standard deviation of the mean monthly temperature during the period 1951-1980. b Global annual mean series (1880−2020) of the ratio of observed local monthly temperature records on land compared to those expected in a stationary climate. The thick black line shows the trend with a 10-yr smoothing window, and the magenta line and shading show the median and 90% confidence interval for the statistical model driven by the long-term global warming trend over land and Gaussian noise. Source: Increasing heat and rainfall extremes now far outside the historical climate - npj Climate and Atmospheric Science

In the title, Dagsvik and Moen ask, 'How much does the temperature change due to greenhouse gas emissions?' Their statistical model, however, does not use any data on greenhouse gases. After they have asserted, in their review, that multiple factors affect temperatures including natural variations, their model does not take such natural influences into account. It is completely useless to investigate the question they have posed. According to the model, the maximum temperature that can be expected within the normal range on a random July day in Oslo is 51 degrees Celsius! Only when it gets even warmer will the model allow that temperatures are outside the normal range. An instrument that is so insensitive cannot be used to evaluate theories of climate change, because these do not suggest that temperatures should have increased by tens of degrees because of past greenhouse gas emissions.

It should be noted that Dagsvik and Moen could have used their model to investigate the question of whether observed temperatures are inconsistent with the theory that temperatures have increased. This would be closer to answering the question they pose in the title of their manuscript. However, they have not done that.

Like medicine, climate science relies on multiple lines of evidence

When assessing whether the climate is changing due to human influences, the IPCC conducts a much more sophisticated analysis that takes multiple indicators such as temperature records in many locations, elevations, and media, sea level rise, ice melting, and shifts of seasons into account.

Imagine you go to the doctor because you have fever and feel unwell. Given a body temperature of 38 degrees, Dr. Dagsvik would assert that this was in the normal range and send you back to work. A real doctor would instead look at your throat and nose, hear your lungs, maybe send a test of your saliva to the laboratory. She would make a diagnosis based on all these different observations.

I do not understand how Statistics Norway can defend releasing this piece of propaganda in a series of manuscripts that are meant to present early-phase scientific research. Given the unscientific character of the content, they put their own reputation on line.

P.S.: It is somewhat ironic that Dagsvik and Moen criticise the statistical analysis of temperature data through climate researchers and claim that they can do better. Fifteen years ago, physics professor at Berkeley, Richard Muller, did. His Berkeley Earth project received big money from climate skeptics in the U.S. coal industry to disprove the hypothesis that the Earth's temperature has increased. The team improved both the dataset and statistical method. The analysis showed that warming was even stronger than what the Intergovernmental Panel on Climate Change had determined at the time. Berkeley Earth also publishes a guide for climate skeptics, showing the limits of climate science knowledge in a simple manner.

`
"...In the global climate models (GCMs) most of the warming that has taken place since 1950 is attributed to human activity. Historically, however, there have been large climatic variations.Temperature reconstructions indicate that there is a ‘warming’ trend that seems to have been going on for as long as approximately 400 years. Prior to the last 250 years or so, such a trend could only be due to natural causes..."

1700701818296.png


https://www.ssb.no/en/natur-og-milj...594b9225f9d7dc458b0b70a646baec3339/DP1007.pdf
 
No one would care about this if people who like terrible music didn’t die. Taylor Swift’s music has killed more people than any of my firearms ever have
 
Do you think 108F is a normal temperature for Rio. And why shouldn't they mention heat index when it's at such insane levels? How many times have you heard Rio being compared to Death Valley, fool?
Umm What is F ? Rio ? I've seen it 35 - 42 many times.
OH ! "F" stands for Fucking Idiots !
inchforidiot.jpeg
 
I'm terribly sorry you have such issues. Google knows what it means. Do you think 42,2C is a normal temp for Rio?
It's just natural weather for an interglacial period that has not yet reached its peak temperature. It's idiotic to assume that almost all of the warming is due to CO2 when warming and cooling trends have always occurred before man and didn't stop because of CO2.
 

Forum List

Back
Top