And they call me a denier

Marcott only put out his disclaimer of 'not robust' because of heavy criticism coming from the blogosphere. it was easier to retract his claims rather than defend them and besides, the press releases had already gone out and the paper would be famous in the public eye as a new and improved hockeystick. rebuttals and even retractions of papers arent 'newsworthy' and the public doesnt hear about it.


as far as unprecidented rate of warming in the modern era....in a past thread I showed an analysis of the Vostock (?) ice core that checked all of the 1C temp spikes in our temp range. there were dozens, many with greater than 1C rises, some that lasted longer than 100 years. none of them led to a 'tipping point'. our recent spike actually looked like it could have been the calculated average rather than just another data point. got that? there is nothing special about our temps other than the obcession about CO2 by the doomsayers.

Agreed about Marcott's "honesty".. Don't remember that Vostok type of graph before..
I'm not doubting that our CEra warming is not unique, but I'm doubting that the true RATES of those graphs are accurate. They may paint a picture of relative rates, but maybe not absolute values of either rates or magnitudes..

What is your knowledge of the claimed time resolution on ancient ice cores? I remember all kinds of "alignments" and "corrections" leading to some general statement about 25 -- 50 year at THOSE time scales..

But ice is a very non-linear proxy.. And if temperatures DID spike that high, the melt rates would be severe in those layers --- wouldn't they? How do you control for stuff like that and claim a 25 -- 50 year time resolution over milleniums??

Antarctica ice cores dont have as much of a problem with melt rates as other locations. while I am sure that there could be a problem with the yearly striations, ice cores are likely to be the best long term proxy that we have. antarctic ice is not melting now, the comparisons are between very cold and even more cold. I have a healthy dose of suspicion for all proxy results but if we have to use a proxy this is one of the more robust ones. it shows results that put our recent warming in a very average position.

And these ice cores (from various locations) have shown that CO2 does not drive climate.

Because at no time ANYWHERE in those cores have CO2 levels risen as they have in the last 150 years. CO2 has likely not spiked as it is currently since the KT impact. No one on my side of this argument has ever claimed that it has. You folks are the ones consistently attempting to show that this is just natural and has happened many times before. Well, how about you show us the many times in the past where CO2 was artificially driven up as it has been now? And while you're looking at the record, how about explaining why every time temperature did drive up CO2 levels, the CO2 quickly (<200 years, say) took over: supporting, extending and worsening the temperature increase via the Greenhouse Effect you so love to doubt. Eh?
 
Last edited:
are you referencing Marcott or Shakun? my graph is only using Vostok, cutoff is 1C below present temp.

what is your understanding of 'hide the decline', and 'Mike's Nature trick'?

As you know, both Marcott and Shakun have been lead authors on studies using a wide variety of proxies to determine best estimates of temperatures during the Holocene since the last glaciation. Denialists have accused both of putting out data that had so little temporal resolution that a "warming spell" such as we're experiencing at present could have happened and not show in their record.

You know this as well as I. It's why you put up the Vostok acceleration data. I just want to know what you think you've accomplished by doing so.

perhaps I was not clear enough. I wanted to know if you were talking about Marcott2013 or Shakun2012. both of which I have started threads about. Marcott is a new PhD whose thesis was the basis for Marcott2013 which was turned into a hockeystick with the help of Shakun. Shakun2012 was a feeble attempt to show how CO2 was a major component of the swing from ice age to interglacial. which one were you refering to? they both have SIs with their proxy names and data.

and I will ask you again about 'hide the decline'. what is your understanding of the term, and do you defend it? what is your understanding of 'Mike's Nature trick', and do you defend it?

just wondering if you are going to respond or not. you were the one who questioned me, but now you seem to be unresponsive.
 
Agreed about Marcott's "honesty".. Don't remember that Vostok type of graph before..
I'm not doubting that our CEra warming is not unique, but I'm doubting that the true RATES of those graphs are accurate. They may paint a picture of relative rates, but maybe not absolute values of either rates or magnitudes..

What is your knowledge of the claimed time resolution on ancient ice cores? I remember all kinds of "alignments" and "corrections" leading to some general statement about 25 -- 50 year at THOSE time scales..

But ice is a very non-linear proxy.. And if temperatures DID spike that high, the melt rates would be severe in those layers --- wouldn't they? How do you control for stuff like that and claim a 25 -- 50 year time resolution over milleniums??

Antarctica ice cores dont have as much of a problem with melt rates as other locations. while I am sure that there could be a problem with the yearly striations, ice cores are likely to be the best long term proxy that we have. antarctic ice is not melting now, the comparisons are between very cold and even more cold. I have a healthy dose of suspicion for all proxy results but if we have to use a proxy this is one of the more robust ones. it shows results that put our recent warming in a very average position.

And these ice cores (from various locations) have shown that CO2 does not drive climate.


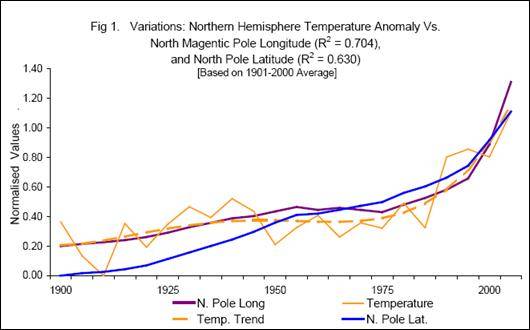
the ice cores imply that CO2 responds to temperature changes. because there is a lag for increase of CO2 that would imply temperature is the causation but it does not rule out a small positive feedback of some sort.

I would recommend looking into Salby's work for more info.
 
I'm not doubting that our CEra warming is not unique, but I'm doubting that the true RATES of those graphs are accurate. They may paint a picture of relative rates, but maybe not absolute values of either rates or magnitudes..

Just caught this. I'm glad you don't doubt the novelty of the current temperature regime (despite the double-negative (they ARE tough to avoid around here)), but how about explaining to us what would be the difference between an absolute warming rate and a relative warming rate.
 
Last edited:
As you know, both Marcott and Shakun have been lead authors on studies using a wide variety of proxies to determine best estimates of temperatures during the Holocene since the last glaciation. Denialists have accused both of putting out data that had so little temporal resolution that a "warming spell" such as we're experiencing at present could have happened and not show in their record.

You know this as well as I. It's why you put up the Vostok acceleration data. I just want to know what you think you've accomplished by doing so.

perhaps I was not clear enough. I wanted to know if you were talking about Marcott2013 or Shakun2012. both of which I have started threads about. Marcott is a new PhD whose thesis was the basis for Marcott2013 which was turned into a hockeystick with the help of Shakun. Shakun2012 was a feeble attempt to show how CO2 was a major component of the swing from ice age to interglacial. which one were you refering to? they both have SIs with their proxy names and data.

and I will ask you again about 'hide the decline'. what is your understanding of the term, and do you defend it? what is your understanding of 'Mike's Nature trick', and do you defend it?

just wondering if you are going to respond or not. you were the one who questioned me, but now you seem to be unresponsive.

I am not retired and it is the holiday season. Many reasons to not sit down at the machine and argue. Did you answer the question re "hide the decline"? I don't see it here. I see an attempt to avoid answsering a question by posing another one.

If you don't like the work of Marcott and Shakun, show us some work refuting their conclusions. The Vostok acceleration graph (to which I did briefly respond) is impressive but I wonder how those ice cores, which suffer at least as much as Marcott and Shakun's proxies re temporal resolution, were able to identify rates such as you show without boiling the planet. Could you expand on the development of those data?
 
Last edited:
hahaha. sure, like the proxy records that had to be amputated from the record in Mann98. or dont you remember 'hide the decline'?

I hope you don't disappoint me, but please tell us what YOU believe "hide the decline" meant.

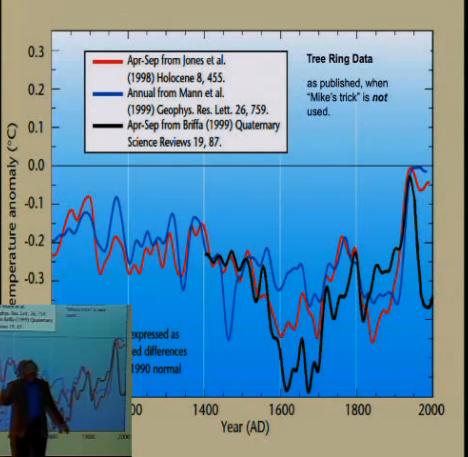
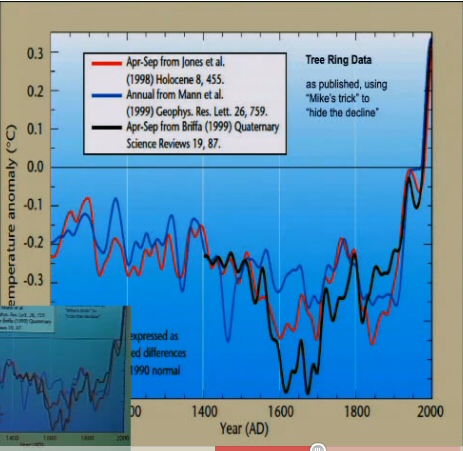
hide the decline refers to the anti-scientific act of truncating the proxy record at 1960 in Mann98,99 so that it would not be obvious that the proxy record had wildly diverged. 'Mike's Nature trick' refers to removing embarrassing data by replacing it with modern high resolution instrumental data.

hide-the-decline-before.jpg


hide-the-decline-tree-ring-data1.jpg


two screen captures from Muller's video that talks about the blatant dishonesty of Mann's papers.

Professor Jonathon Jones:

“People have asked why mainstream scientists are keeping silent on these issues. As a scientist who has largely kept silent, at least in public, I have more sympathy for silence than most people here. It’s not for the obvious reason, that speaking out leads to immediate attacks, not just from Gavin and friends, but also from some of the more excitable commentators here. Far more importantly most scientists are reluctant to speak out on topics which are not their field. We tend to trust our colleagues, perhaps unreasonably so, and are also well aware that most scientific questions are considerably more complex than outsiders think, and that it is entirely possible that we have missed some subtle but critical point.

However, “hide the decline” is an entirely different matter. This is not a complicated technical matter on which reasonable people can disagree: it is a straightforward and blatant breach of the fundamental principles of honesty and self-criticism that lie at the heart of all true science.

The significance of the divergence problem is immediately obvious, and seeking to hide it is quite simply wrong. The recent public statements by supposed leaders of UK science, declaring that hiding the decline is standard scientific practice are on a par with declarations that black is white and up is down. I don’t know who they think they are speaking for, but they certainly aren’t speaking for me.

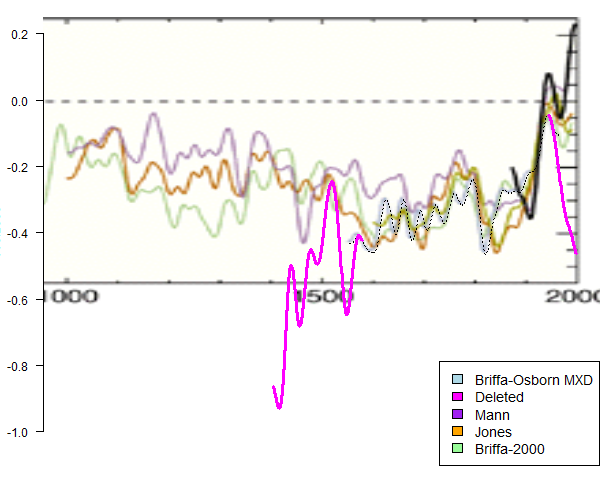
interestingly enough, Briffa had already truncated the beginning of his proxy series. and of course there is the Briffa Bodge as well. science is not supposed to be done by cutting out the evidence you like and hiding the evidence that you dont.

briffa99-science_notrick2.png


perhaps you missed this direct response to your question. I could actually get into the details of how modern temp data were actually added into the proxy data to assure a smooth splice at the truncation but that is a bit excessive for a first response.

I also cannot find any questions posed by me in this comment.
 
perhaps I was not clear enough. I wanted to know if you were talking about Marcott2013 or Shakun2012. both of which I have started threads about. Marcott is a new PhD whose thesis was the basis for Marcott2013 which was turned into a hockeystick with the help of Shakun. Shakun2012 was a feeble attempt to show how CO2 was a major component of the swing from ice age to interglacial. which one were you refering to? they both have SIs with their proxy names and data.

and I will ask you again about 'hide the decline'. what is your understanding of the term, and do you defend it? what is your understanding of 'Mike's Nature trick', and do you defend it?

just wondering if you are going to respond or not. you were the one who questioned me, but now you seem to be unresponsive.

I am not retired and it is the holiday season. Many reasons to not sit down at the machine and argue. Did you answer the question re "hide the decline"? I don't see it here. I see an attempt to avoid answsering a question by posing another one.

If you don't like the work of Marcott and Shakun, show us some work refuting their conclusions. The Vostok acceleration graph (to which I did briefly respond) is impressive but I wonder how those ice cores, which suffer at least as much as Marcott and Shakun's proxies re temporal resolution, were able to identify rates such as you show without boiling the planet. Could you expand on the development of those data?

boiling the planet? perhaps you dont understand the concept. the Vostok cores were scoured to find temperature jumps during the interglacials. obviously after the endpoints, temperature went down.

Abraham didn't just "miss" your post Ian.. He has so little comprehension of this topic that if you pepper him with data and graphs WITHOUT the Cliff Notes -- he has no clue what he's seeing or reading.. It MUST appear in a poll or have been read on skepticalscience...

You're working too hard -- but I appreciate it.. :cool:
 

Kosh -- I'm not saying that there COULDN'T be a relationship here. But 1000s of parametric physical relations have that shape.. It's as interesting as the graphical match between CO2 and temp.. But without a mechanism for that math, it just remains an observation -- not a theory.

In that graph -- it is the movement of Magnetic pole that is causing the relationship.. The Geo pole is not moving fast at all.
I seriously HOPE that's the case... :lol:

Magnetic NORTH is not Rotational or Geographic NORTH.. The precession of the latter Geographical Pole IS a climate forcing.. And it is a SERIOUS climate influence. But Milankovitch cycles describing climate and GEO north have been known for decades.. and not the same as Magnetic north.. ((or if you ponder it -- the DIFFERENCE between magnetic and geo north))
:eusa_angel:
 
Last edited:
perhaps I was not clear enough. I wanted to know if you were talking about Marcott2013 or Shakun2012. both of which I have started threads about. Marcott is a new PhD whose thesis was the basis for Marcott2013 which was turned into a hockeystick with the help of Shakun. Shakun2012 was a feeble attempt to show how CO2 was a major component of the swing from ice age to interglacial. which one were you refering to? they both have SIs with their proxy names and data.

and I will ask you again about 'hide the decline'. what is your understanding of the term, and do you defend it? what is your understanding of 'Mike's Nature trick', and do you defend it?

just wondering if you are going to respond or not. you were the one who questioned me, but now you seem to be unresponsive.

I am not retired and it is the holiday season. Many reasons to not sit down at the machine and argue. Did you answer the question re "hide the decline"? I don't see it here. I see an attempt to avoid answsering a question by posing another one.

If you don't like the work of Marcott and Shakun, show us some work refuting their conclusions. The Vostok acceleration graph (to which I did briefly respond) is impressive but I wonder how those ice cores, which suffer at least as much as Marcott and Shakun's proxies re temporal resolution, were able to identify rates such as you show without boiling the planet. Could you expand on the development of those data?


No rush Abe. Just identify the Marcott or Shakun paper you were referring to. Oh, and I would like to know if you defend 'hide the decline'.

so you dont remember being asked about 'hide the decline'?

methinks you are telling fibs Abe. naughty, naughty. someone's going to get a lump of coal in their stocking.

...from white Santa
 
I am not retired and it is the holiday season. Many reasons to not sit down at the machine and argue. Did you answer the question re "hide the decline"? I don't see it here. I see an attempt to avoid answsering a question by posing another one.

If you don't like the work of Marcott and Shakun, show us some work refuting their conclusions. The Vostok acceleration graph (to which I did briefly respond) is impressive but I wonder how those ice cores, which suffer at least as much as Marcott and Shakun's proxies re temporal resolution, were able to identify rates such as you show without boiling the planet. Could you expand on the development of those data?


No rush Abe. Just identify the Marcott or Shakun paper you were referring to. Oh, and I would like to know if you defend 'hide the decline'.

so you dont remember being asked about 'hide the decline'?

methinks you are telling fibs Abe. naughty, naughty. someone's going to get a lump of coal in their stocking.

The last post you quoted, the one that begins "No rush Abe", I am seeing now for the first time. So, no, up till this point I had not seen your query. Have I now answered it to your satisfaction (in the other (Marcott) thread)?

I still have not seen YOUR answer to the question I apparently put to you first as indicated by my earliest quote here. Nor any response to my request for some expansion on the Vostok acceleration data.
 
Last edited:
Abraham didn't just "miss" your post Ian.. He has so little comprehension of this topic that if you pepper him with data and graphs WITHOUT the Cliff Notes -- he has no clue what he's seeing or reading.. It MUST appear in a poll or have been read on skepticalscience...

Merry Christmas!
Happy New Year!
Shove your head up your ass and jump!
 
Last edited:

Keep in mind, Ian, that to make these invisible in Shakun and Marcott's data, it'd also have to come back down to where it had been, in the period blocked by their coarse resolution.

are you referencing Marcott or Shakun? my graph is only using Vostok, cutoff is 1C below present temp.

what is your understanding of 'hide the decline', and 'Mike's Nature trick'?

Ahh, I've found it.

Mike's Nature trick of hiding the decline was a method of dealing with the divergence problem with tree ring proxies and 20th century temperatures. The conversion ratio altered significantly as dates moved into the last century. It was a perfectly acceptable practice about which they were open and which was widely discussed. The divergence problem is well known among dendrochronologists.

My problem with those Vostok temperature change values is that if they represented actual temperature trends, then much larger changes should have taken place. If some process is causing the Earth's temperature to increase by 2.5K in 40 years or by 3K in 90 years, there should have been a much larger change over a longer time period - events which would have been visible in Shakun's and Marcott's data but were not. That leads me to the conclusion that these values are spurious, particularly since we are talking about ONE proxy set that has at least as much diffusion-related loss of temporal resolution as any of Marcott's. And his resolution would not have supported the data you've just presented, would it.
 

Forum List

Back
Top