From the Watts Up With That? website
The blue line shows the number of stations that are taking recordings. The red line shows where there is data missing. Usually this data is between 1 and 9 days. So in theory ALL of them could be one day missing something. Making assumptions that the temperature in Singapore was 35C degrees every day of the month except the one day they forgot to measure because it was at -50C degrees simply isn't going to happen.
All in all, if you look at the last 15 years you're looking at less than 1/4 of the data is missing possibly 1 day, and not more than 9 days.
Now this chart, they've gone from less than 25% where they have to fill in data because it's not been recorded, for whatever reason, such as electricity failure in third world countries etc. And they've got the purple line where the records are "estimated", as far as I can make out because a little bit of the information is missing.
This would be potentially 1/30th of 1/4 of the information. So, 95% of the data isn't 100% complete.
And again, how wild are the temperatures we're looking at. If you have temperatures for the month that range between a few degrees, and then they have to estimate a temperature one day, and it's the same as the 10 days before, chances are the temperature is going to be pretty close.
So say 95% of the data is wrong is misleading. 95% of the data, based on 1/120th of the information being estimated, which might be out by a small amount, shows how you can make statistics say what you like.
Is 95% of the data wrong or is less than 1% of the data slightly out? There's a big difference between the two.
Their conclusions is:
"The US accounts for 6.62% of the land area on Earth, but accounts for 39% of the data in the GHCN network. Overall, from 1880 to the present, approximately 99% of the temperature data in the USHCN homogenized output has been estimated (differs from the original raw data). Approximately 92% of the temperature data in the USHCN TOB output has been estimated. The GHCN adjustment models estimate approximately 92% of the US temperatures, but those estimates do not match either the USHCN TOB or homogenized estimates."
So, the US makes up 39% of the data means what? Does it mean that 39% of the data is being used equally with the other data, or does it mean that they adjust the data to make it fit? Well they sourced their own previous article and it doesn't say. So.... they're making a claim and not backing it up.
The point here should be that many third world nations are third world nations and can't always collect data as well as a first world country. Their data might not be 100% perfect, that doesn't mean that all the data around the world is wrong. It also doesn't mean that 95% of data, or 99% of data is irrelevant.
Approximately 66% of global surface temperature data consists of estimated values
The previous article suggests that 66% of data contains some estimates. So they can't even decide if it's 66% of 99%.
Even the 66% of data with estimates doesn't mean it's wildly wrong. It means that some of the data is estimated. It's not hard to estimate the data in many cases. If you look at the weather for 4 days and then not the fifth and the temperature feels about the same, then look on the 6th day and it's about the same and feels the same, you could pretty much guess what the temperature on the 5th day was.
So while they make valid points that the data is 100% reliable, there is nothing to suggest the data is too unreliable in order to change global temperatures massively. You're talking about 1% of data being estimated and it's probably not being estimated outside of a 1C degree of inaccuracy.
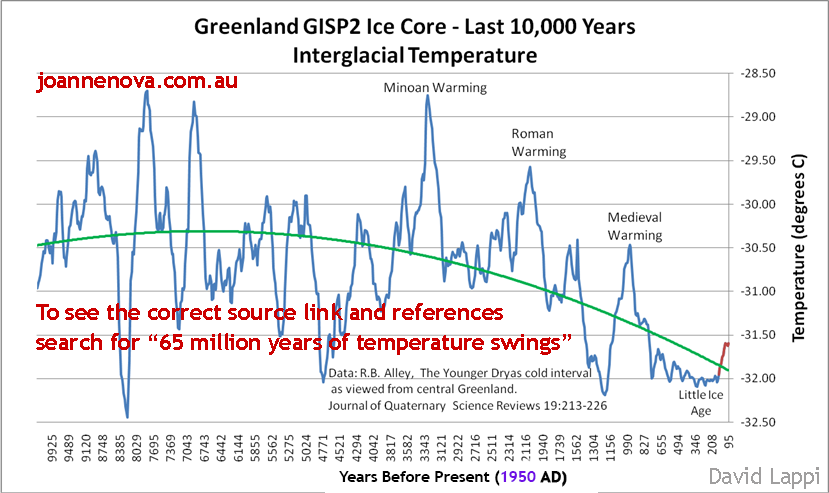
Climate has ALWAYS changed!
Temperature record with CO2 levels for the last 600 million years
Last 10,000 years
Why Hansen Had To Corrupt The Temperature Record | Real Science
NASA GISS - Adjusting the Adjustments
As a simple exercise, I quickly revisited the everchanging Hansen adjustments, a topic commented on acidly by E.M. Smith (Chiefio) in many posts – also see his interesting comments in the thread at a guest post at Anthony‘s, a post which revisited the race between 1934 and 1998 – an issue first raised at Climate Audit in 2007 in connection with Hansen’s Y2K error.
As CA readers recall, Hansen’s Y2K error resulted in a reduction of US temperatures after 2000 relative to earlier values. The change from previous values is shown in red in the graphic below; the figure also shows (black) remarkable re-writing of past history since August 2007 – a rewriting of history that has increased the 2000-6 relative to the 1930s by about 0.3 deg C.
Climategate: The Smoking Code | Watts Up With That?
Now, here is some actual proof that the CRU was deliberately tampering with their data. Unfortunately, for readability’s sake, this code was written in Interactive Data Language (IDL) and is a pain to go through.
NOTE: This is an actual snippet of code from the CRU contained in the source file: briffa_Sep98_d.pro
1;
2; Apply a VERY ARTIFICAL correction for decline!!
3;
4 yrloc=[1400,findgen(19)*5.+1904]
5 valadj=[0.,0.,0.,0.,0.,-0.1,-0.25,-0.3,0.,-0.1,0.3,0.8,1.2,1.7,2.5,2.6,2.6,2.6,2.6,2.6]*0.75 ; fudge factor
6 if n_elements(yrloc) ne n_elements(valadj) then message,'Oooops!'
7
8 yearlyadj=interpol(valadj,yrloc,timey)
So the fudge factor is adjusting each year by their calendar year starting with 1904, in five year increments. Note that starting in 1930 the function arbitrarily subtracts 0.1 degrees, then in 1936 it removes 0.25, etc. Then in 1955 it begins to ADD temperature adjustments beginning with 0.3, etc.
Is it any wonder we have 'global warming' according to these liars?
Just the name 'fudge factor' at line 5 should be a dead give away.
Hansen's NASA GISS - cooling the past, warming the present
I ran a post yesterday, showing how the latest version of GISSTEMP had changed from using Hadley/Reynolds to ERSST for ocean temperatures, with the result that about 0.03C had been added to recent warming.
However, this is not the only change they have made to the historical temperature record in recent years. Climate4You, fortunately, archived the GISS data in May 2008. Comparing this dataset with today’s version, we can see that about 0.10C of warming, or more, has been added to temperatures in the last decade, compared to data up to about 1950.
Very revealing programmer comments found in the hacked emails in the Climategate scandal, and they explain how we have 'Global Warming' no matter what the temperatures may actually be.
And note how they call the temperatures they want to see the 'real' temperatures, when ordinary people might think the MEASURED proxy temperatures would be the 'real' temperatures or else the proxy temps are worthless anyway!
Climategate: hide the decline ? codified | Watts Up With That?
WUWT blogging ally Ecotretas writes in to say that he has made a compendium of programming code segments that show comments by the programmer that suggest places where data may be corrected, modified, adjusted, or busted. Some the HARRY_READ_ME comments are quite revealing. For those that don’t understand computer programming, don’t fret, the comments by the programmer tell the story quite well even if the code itself makes no sense to you....
?FOIA\documents\osborn-tree6\mann\oldprog\maps12.proFOIA\documents\osborn-tree6\mann\oldprog\maps15.proFOIA\documents\osborn-tree6\mann\oldprog\maps24.pro; Plots 24 yearly maps of calibrated (PCR-infilled or not) MXD reconstructions
; of growing season temperatures. Uses "corrected" MXD - but shouldn't usually
; plot
past 1960 because these will be artificially adjusted to look closer to
; the real temperatures.
....
; anomalies against full NH temperatures and other series.
; CALIBRATES IT AGAINST THE LAND-ONLY TEMPERATURES NORTH OF 20 N
;
; Specify period over which to compute the regressions
(stop in 1960 to avoid
; the decline
......
; Specify period over which to compute the regressions
(stop in 1960 to avoid
; the decline that affects tree-ring density records)
...
;getting seriously fed up with the state of the Australian data. so many new stations have been
; introduced, so many false references.. so
many changes that aren't documented.
....
;I am very sorry to report that the rest of the databases seem to be in nearly as poor a state as
; Australia was.
There are hundreds if not thousands of pairs of dummy stations
...
Here, the
expected 1990-2003 period is MISSING - so the correlations aren't so hot! Yet
the WMO codes and station names /locations are identical (or close).
What the hell is
supposed to happen here? Oh yeah - there is no 'supposed', I can make it up. So I have ")
...
It's Sunday evening, I've worked all weekend, and just when I thought it was done I'm
hitting
yet another problem that's based on the hopeless state of our databases. There is no uniform
data integrity, it's just a catalogue of issues that continues to grow as they're found.
...
printf,1,’(April-September) temperature anomalies (from the 1961-1990 mean).’
printf,1,’Reconstruction is based on tree-ring density records.’
printf,1
printf,1,
’NOTE: recent decline in tree-ring density has been ARTIFICIALLY’
printf,1,’REMOVED to facilitate calibration. THEREFORE, post-1960 values’
printf,1,’will be much closer to observed temperatures then they should be,’
printf,1,’which will incorrectly imply the reconstruction is more skilful’
printf,1,’than it actually is.
...
printf,1,'temperature in many high-latitude locations. In this data set'
printf,1,
'this "decline" has been artificially removed in an ad-hoc way, and'
printf,1,'this means that data after 1960 no longer represent tree-ring
printf,1,'density variations, but have been modified to look more like the
printf,1,'observed temperatures.'
.....
;
Apply a VERY ARTIFICAL correction for decline!!
;
yrloc=[1400,findgen(19)*5.+1904]
valadj=[0.,0.,0.,0.,0.,-0.1,-0.25,-0.3,0.,-0.1,0.3,0.8,1.2,1.7,2.5,2.6,2.6,$
2.6,2.6,2.6]*0.75 ; fudge factor
(...)
;
;
APPLY ARTIFICIAL CORRECTION
;
yearlyadj=interpol(valadj,yrloc,x)
densall=densall+yearlyadj
...
;*** MUST ALTER FUNCT_DECLINE.PRO TO MATCH THE COORDINATES OF THE
; START OF THE DECLINE *** ALTER THIS EVERY TIME YOU CHANGE ANYTHING ***
...
applied the calibration to unfiltered MXD data (which
; gives a zero mean over 1881-1960) after extending the calibration to boxes
; without temperature data (pl_calibmxd1.pro).
We have identified and
; artificially removed (i.e. corrected) the decline in this calibrated
; data set. We now recalibrate this corrected calibrated dataset against
; the unfiltered 1911-1990 temperature data, and apply the same calibration
; to the corrected and uncorrected calibrated MXD data.