Wonder WHY We Haven't Gotten the June GW Update???

Thanks for that. It is interesting that Spencer of UAH made a prediction back in January that he wouldn't be asked to peer review the upcoming paper. Odd that the only other team making a satellite temperature product is not asked for their expert input.
From Spencer himself citing his partner in crime Christy:
On the Divergence Between the UAH and RSS Global Temperature Records « Roy Spencer, PhD
Anyway, my UAH cohort and boss John Christy, who does the detailed matching between satellites, is pretty convinced that the RSS data is undergoing spurious cooling because RSS is still using the old NOAA-15 satellite which has a decaying orbit, to which they are then applying a diurnal cycle drift correction based upon a climate model, which does not quite match reality.


So RSS corrects for the decaying satellite orbit that even Spencer and Christy say they must do, and BigotBarf accuses them of cheating, and denier assholes mindlessly parrot it in a public forum while other morons thank them! :cuckoo"
 
The RSS crew is now on the Denier Enemies List, being that RSS TLT 4.0 now shows more warming that the surface temperature records.

FAQ about the V4.0 TLT Update | Remote Sensing Systems

Deniers used to love RSS above all other data, solely because the RSS data showed what they wanted to see. Now deniers hate them, solely because their data shows the opposite.

The rational people here have always based their judgements entirely on whether the science is good.

The very irrational deniers have always base their judgements entirely on whether the outcome matches the preconceived conclusions of their political cult.
 
It's nowhere to be found. Likely Trump's fault for Tweeting everything else off the front pages.

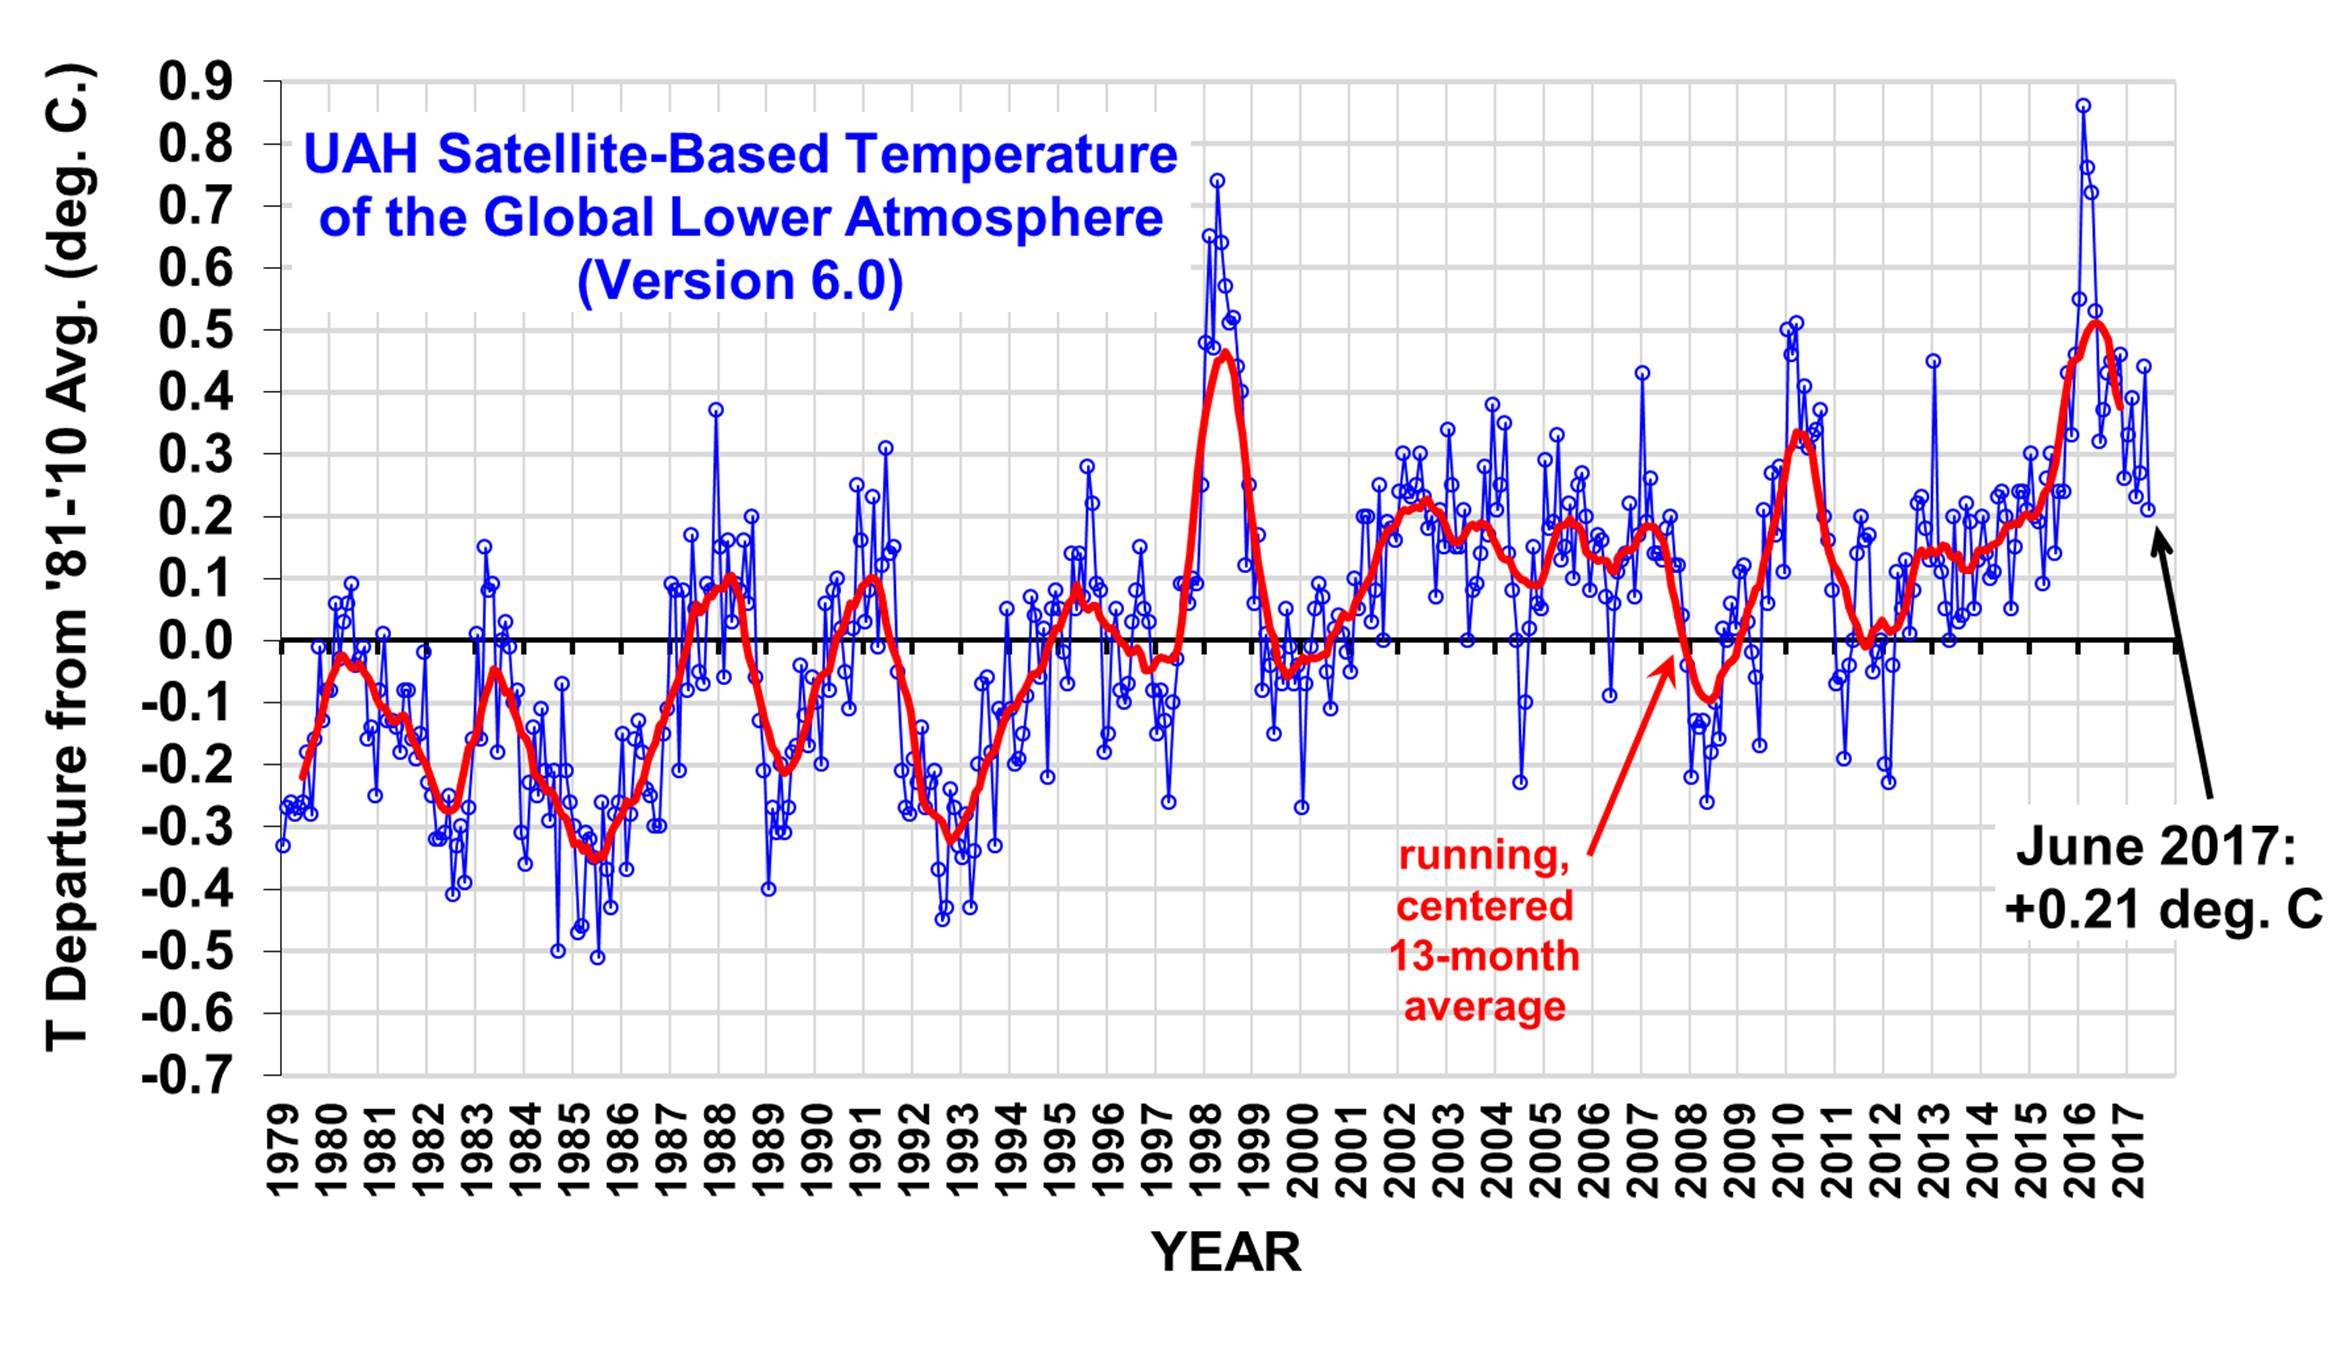
UAH Global Temperature Update for June, 2017: +0.21 deg. C
July 3rd, 2017
Lowest global temperature anomaly in last 2 years (since July, 2015)

The Version 6.0 global average lower tropospheric temperature (LT) anomaly for June, 2017 was +0.21 deg. C, down from the May, 2017 value of +0.44 deg. C (click for full size version):


UAH_LT_1979_thru_June_2017_v6.jpg


We are now Post El Nino -- and not much has changed..
Nice chart.

Looks like GW (Global Warming) began in 1988 -- GHW Bush was POTUS then.

Then it fell during the WJ Clinton era.

Then it took off again during Dubya's terms but leveled out and then crashed during the Great Recession onset.

Since then GW has been steeply on the rise again under Obama.

However lately GW has been ticking downwards slightly after peaking in Obama's last days/daze.

I don't see any correlations.

GW seems to track upwards with global economic growth and decline with recession.

Ergo only recessionary policies will "limit" it.

Not good news.
 

Forum List

Back
Top