- May 20, 2009
- 144,469
- 66,861
- 2,330
It's the soot coming over from Asia
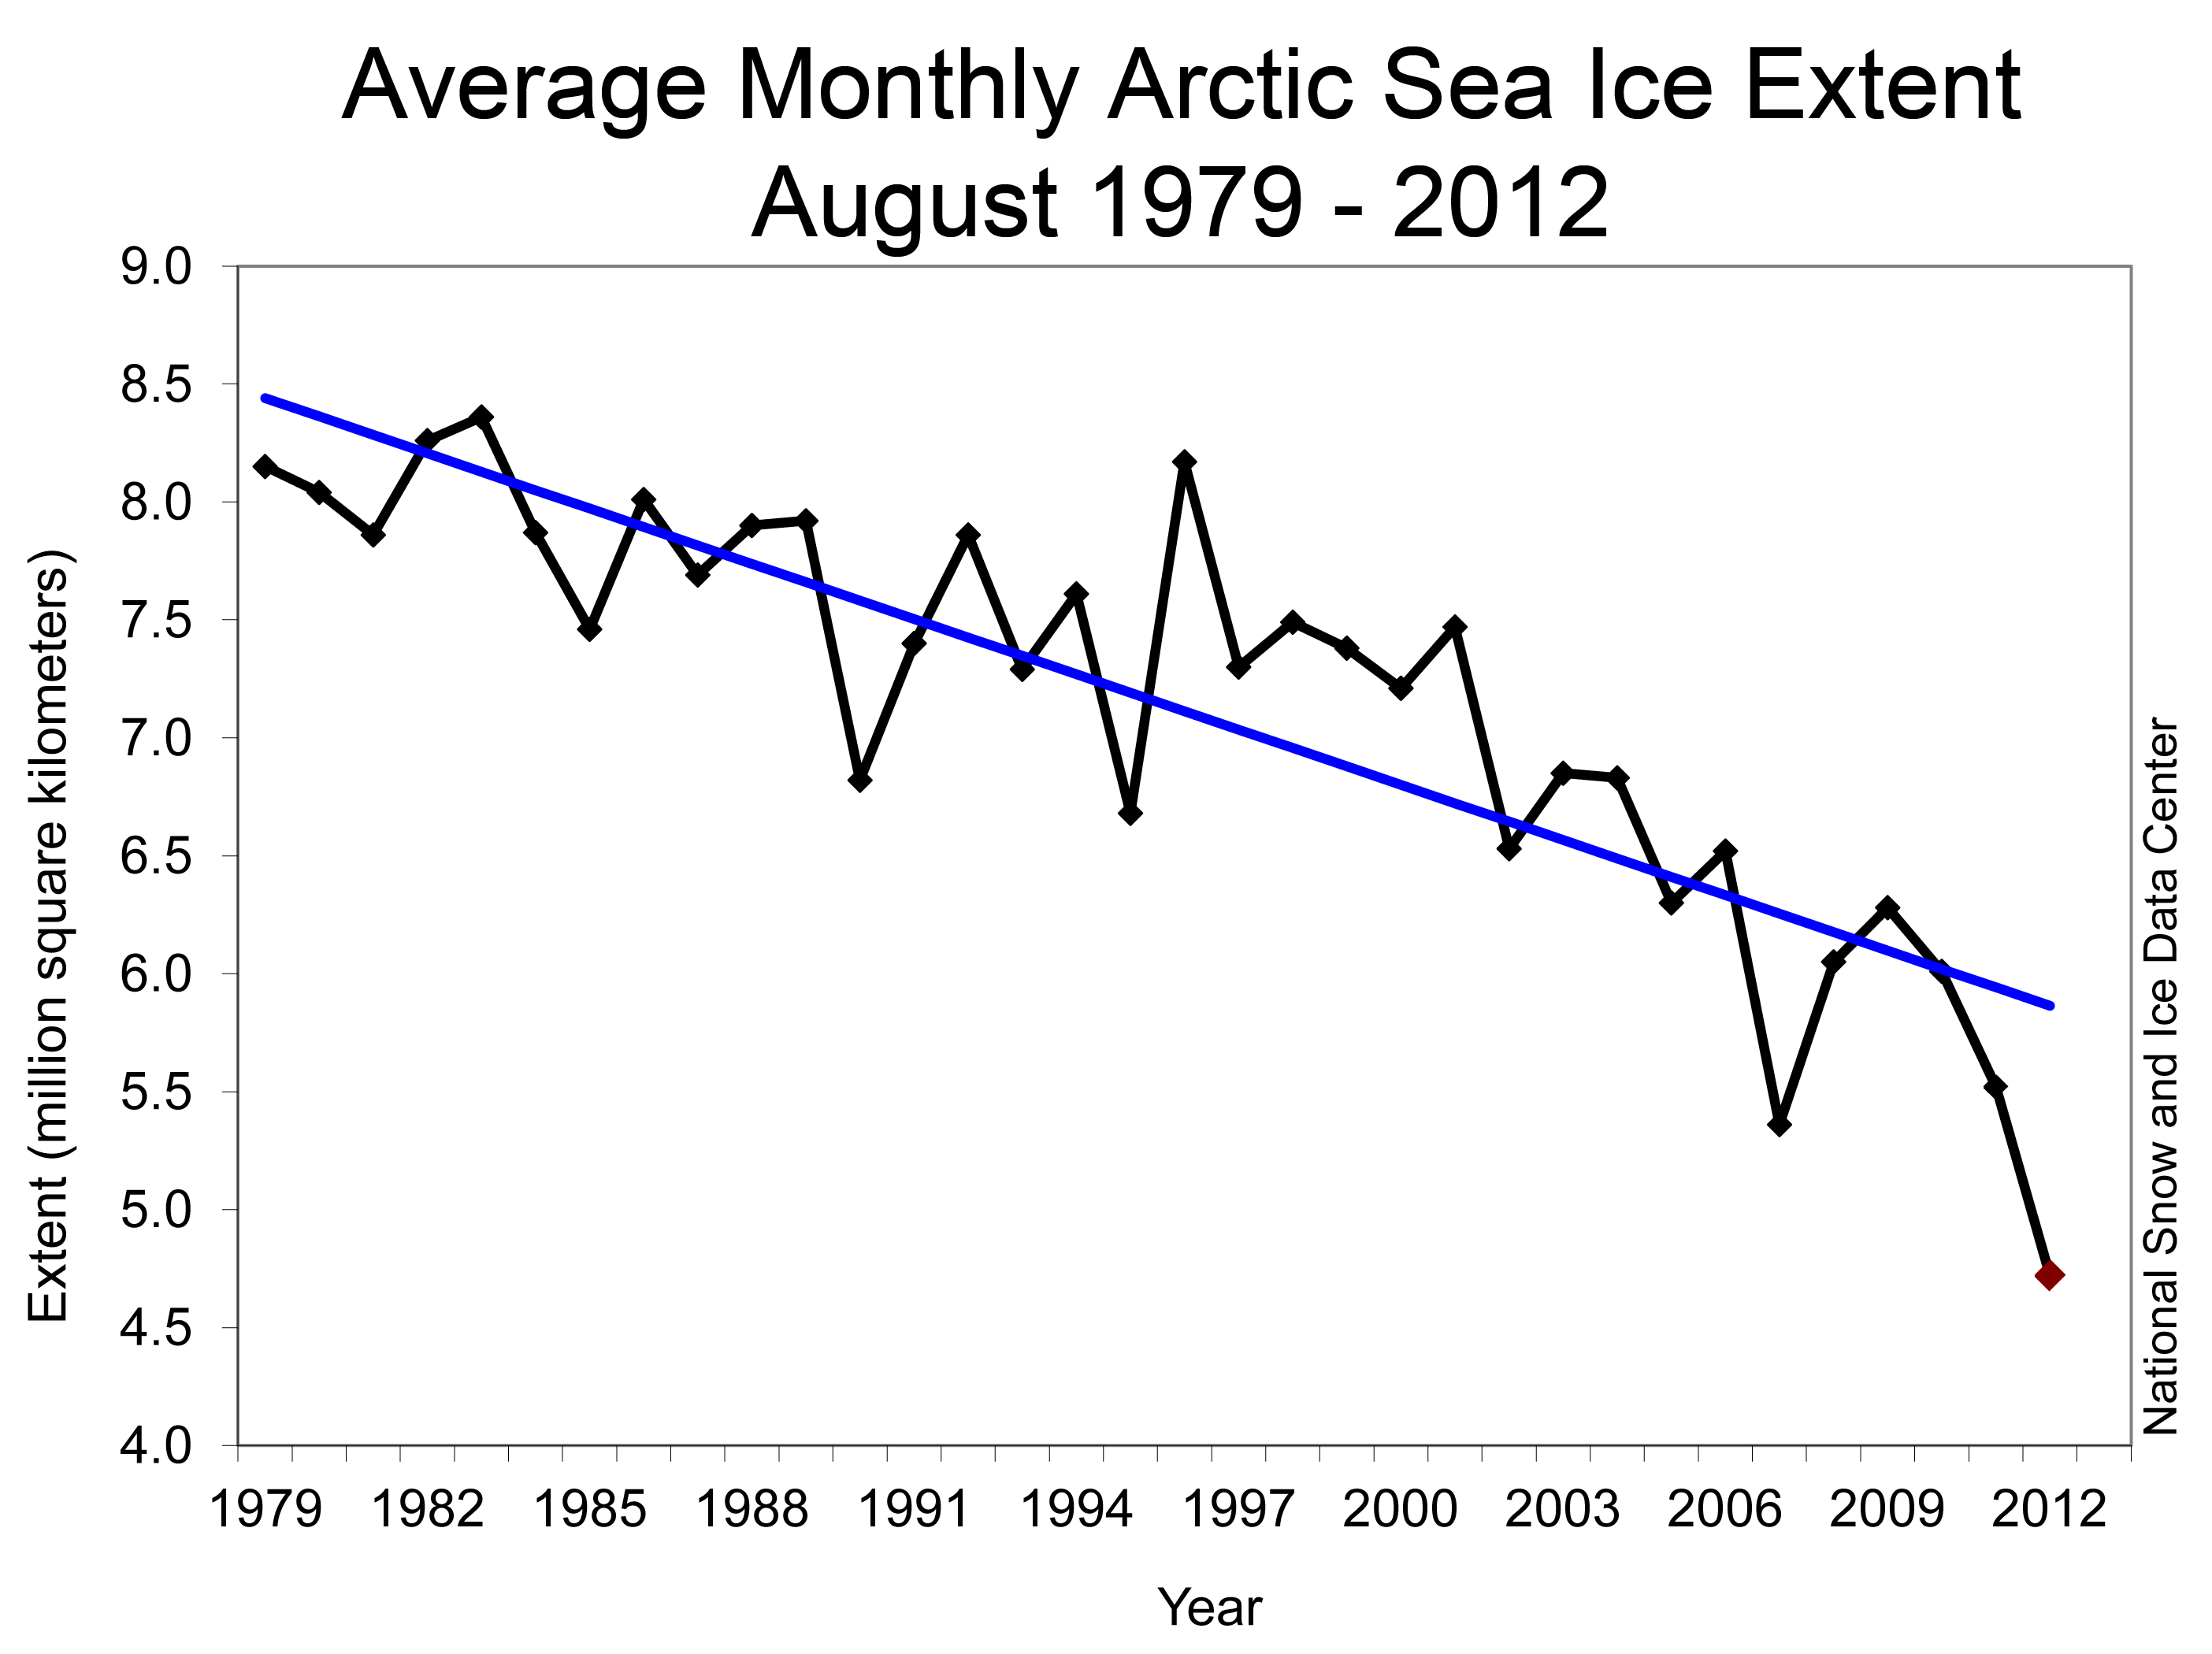
It's .4c of warming since 1979. For whatever reason.
That's not enough to melt the ice, its soot and the aldebo, it fits the facts
Follow along with the video below to see how to install our site as a web app on your home screen.

Note: This feature currently requires accessing the site using the built-in Safari browser.
It's the soot coming over from Asia
It's .4c of warming since 1979. For whatever reason.

Never convince Frankie Boy of that. He is absolutely sure that science has politics.
The fact that you don't believe that speaks volumes... Do you really believe that politics has nothing to do with it when Federal Grant time arrives? If you do, I have a bridge to sell you.
OK, dumb fuck. Are we funding all the scientists in Europe, Asia, Russia, and every other country that has scientists? Because they are all reporting the same thing, that the ice in the glaciers and polar caps is melting. That the tempature of the Earths surface and atmosphere is rising. And that the pattern of the rise is that one would expect from GHGs.
 Not all of the Scientists... But enough of them receive funding from the American Taxpayer. They are not all reporting the same thing... How about a link to that craziness? I recall you were the dumb fuck who said forest fires were the result of man made Global Warming... Man made forestry policies maybe, but that is the extent of it. I don't profess that our planet does not go through temperature changes, but I find it insulting that idiots like you would have us believe that humans are at fault... Ridiculous. I don't recall Oil refineries, SUV's , and Coal powered electricity generating plants as being the root cause for Earth's Ice Age... You better adjust that tin foil hat of yours, this winter is going to be a cold one.
It's the soot coming over from Asia
It's .4c of warming since 1979. For whatever reason.
The fact that you don't believe that speaks volumes... Do you really believe that politics has nothing to do with it when Federal Grant time arrives? If you do, I have a bridge to sell you.
OK, dumb fuck. Are we funding all the scientists in Europe, Asia, Russia, and every other country that has scientists? Because they are all reporting the same thing, that the ice in the glaciers and polar caps is melting. That the tempature of the Earths surface and atmosphere is rising. And that the pattern of the rise is that one would expect from GHGs.
Dumb fuck?
It's the soot coming over from Asia
It's .4c of warming since 1979. For whatever reason.


It's the soot coming over from Asia
It's .4c of warming since 1979. For whatever reason.
Since 1979 the TSI has decreased, but the amount of CO2 and other GHGs has significantly increased.
So, because of the increase in GHGs what should have been a decrease in temperature is now an increase.
Who Knew?
Ice melts above 0degC.. WTHell?
You guys do realize that you are watching ICEBERGS melt, not solid ice. As SIE is usually defined as any cell having 20% or more ice coverage. So on your map projections -- an area that was initially only covered in a small part by ice is now clear... Which is MOST of the extreme Southern extent of the ice cover anyway..
Since 1979 the TSI has decreased, but the amount of CO2 and other GHGs has significantly increased.
So, because of the increase in GHGs what should have been a decrease in temperature is now an increase.
The TSI chart says you're lying. When the line move up, that means it's increasing. Increasing.
See the difference?
Who Knew?
Ice melts above 0degC.. WTHell?
You guys do realize that you are watching ICEBERGS melt, not solid ice. As SIE is usually defined as any cell having 20% or more ice coverage. So on your map projections -- an area that was initially only covered in a small part by ice is now clear... Which is MOST of the extreme Southern extent of the ice cover anyway..
Flatulance, you are one dumb fuck to make a claim like that that can be so easily proven false.
http://arctic.atmos.uiuc.edu/cryosphere/NEWIMAGES/arctic.seaice.color.000.png
That is 2012.
http://arctic.atmos.uiuc.edu/cryosphere/IMAGES/ARCHIVE/19790907.png
That is 1979. Note that the pink and dark pink areas are thick ice.
Far from being a bunch of floating icebergs, the arctic sea ice was solid enough then for dog sled trips to the north pole.
LOLOLOLOL......oh fecalhead, your brand of insanity just keeps on getting funnier and funnier as your sorry excuse for a mind disintegrates due to your cultic myths getting blown away by reality.Who Knew?
Ice melts above 0degC.. WTHell?
You guys do realize that you are watching ICEBERGS melt, not solid ice. As SIE is usually defined as any cell having 20% or more ice coverage. So on your map projections -- an area that was initially only covered in a small part by ice is now clear... Which is MOST of the extreme Southern extent of the ice cover anyway..
Flatulance, you are one dumb fuck to make a claim like that that can be so easily proven false.
http://arctic.atmos.uiuc.edu/cryosphere/NEWIMAGES/arctic.seaice.color.000.png
That is 2012.
http://arctic.atmos.uiuc.edu/cryosphere/IMAGES/ARCHIVE/19790907.png
That is 1979. Note that the pink and dark pink areas are thick ice.
Far from being a bunch of floating icebergs, the arctic sea ice was solid enough then for dog sled trips to the north pole.
Gosh OldieRocks -- I'd usually neg for something like that.. But I've kinda taken a protective role for the hopelessly bewildered.....
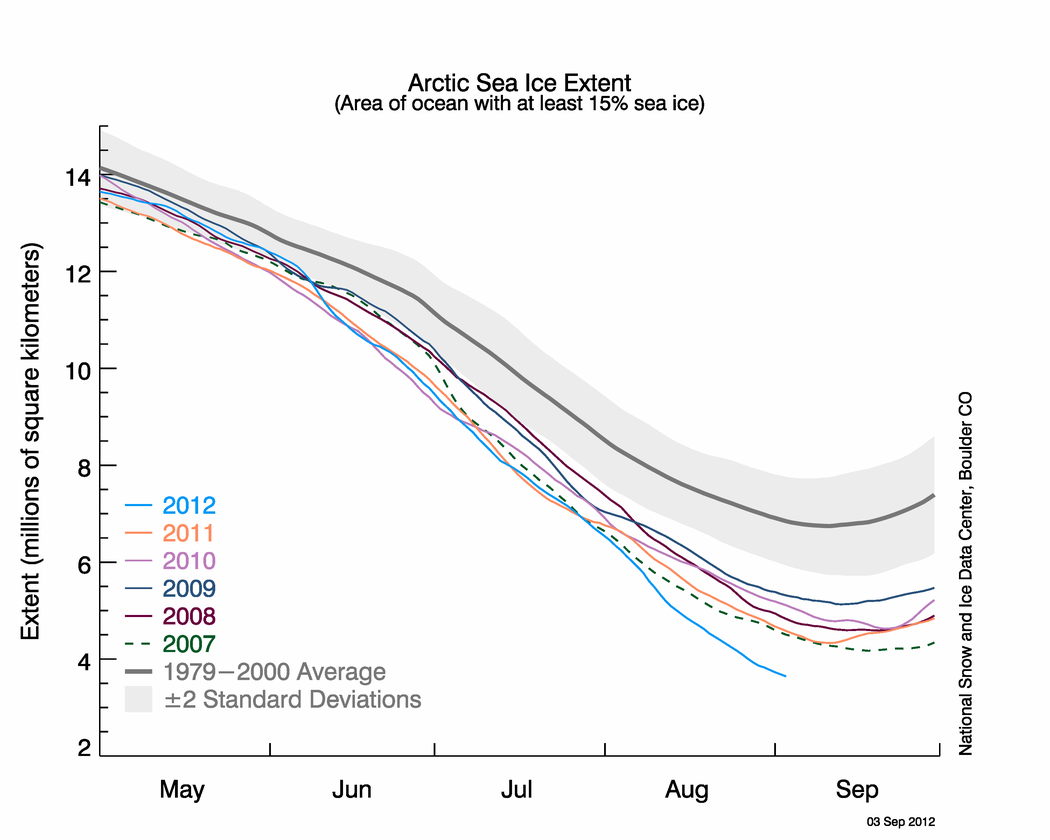
There's a little charty thingy to the left of those images... Notice it says SEA ICE CONCENTRATION.. Go look up the definition and re-read what I wrote above. Annnnnd stop calling me a dumb fuck unless you have a point...
Since 1979 the TSI has decreased, but the amount of CO2 and other GHGs has significantly increased.
So, because of the increase in GHGs what should have been a decrease in temperature is now an increase.
The TSI chart says you're lying. When the line move up, that means it's increasing. Increasing.
See the difference?
For the last decade, the TSI has been down, and is only now coming up. Yet, the last decade is the warmest on record.
TSI Data

In 1979, the only ships in the Arctic were icebreakers and the special ships built for that environment. Since 2005, they have been taking standard recreational sailboats through the Northwest and Northeast Passages, sometimes even circumnavigating the whole ice pack.
The average icepack volume from 1979 to 2001 was just under 14 million cubic kilometers. It is projected to bottom out at 3 million cubic kilometers this year. That is a reduction by a factor of five, almost the whole of the reduction in the last 11 years.
