C'mon..... .......nobody cares about the La Nina updates except the internet OCD's!
And btw.....ding is pwning you dopers!!
.......nobody cares about the La Nina updates except the internet OCD's!And btw.....ding is pwning you dopers!!
Follow along with the video below to see how to install our site as a web app on your home screen.

Note: This feature currently requires accessing the site using the built-in Safari browser.
.......nobody cares about the La Nina updates except the internet OCD's!What is your background in science? I'm an engineer.
Which means you are not a scientist, and that you likely have little understanding of how science works. Engineering and science are different meta-disciplines, and engineers are not trained in how to do science.
Try not to display too much Engineer's Arrogance Syndrome. That's when an engineer assumes the entire world is entirely explainable by his own tiny technical specialty, whatever that may be. For example, we have one engineer here who constantly assumes the planet's climate has to act like a simple electrical circuit.
Also, don't play stupid games with us. If you've got a point to make with your question, make it directly, instead of asking us over and over. After all, we know the answer, and we're starting to think you don't.

 NOAA Eq Pac Upper Ocean Heat Anom issued Nov 28 2016.PNG (22.91 kB, 455x410 - viewed 16 times.) NOAA Eq Pac SSTA Evolution issued Nov 28 2016.PNG (141.83 kB, 446x604 - viewed 16 times.)
Hello, can you tell me why CO2 has not driven past climate changes?Mamooth is right. You've been behaving like a dick. I suspect you've actually got things to bring to the discussion here, but you might have started by walking in and saying hello. Instead, you assumed we were all a bunch of illiterate yahoos and began lecturing us with last year's fish wrap.
According to Raymond S. Bradley, Climatologist and University Distinguished Professor in the Department of Geosciences at the University of Massachusetts Amherst "to anticipate future changes, we must understand how and why climates varied in the past."No one cares, son.
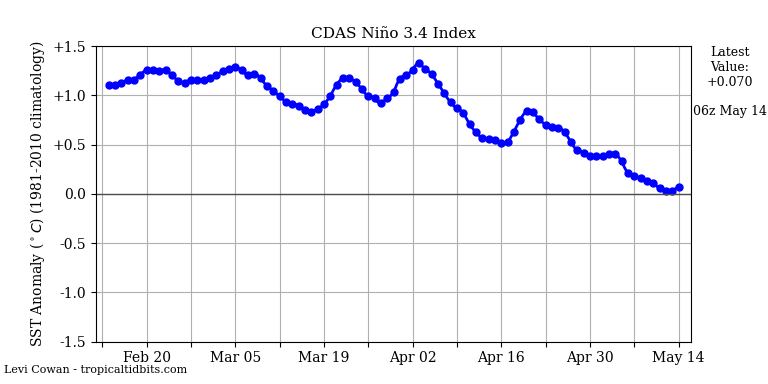
Up to -.25c at 3.4 on the daily....This has to be one of the fastest start and end of a nina in history. La nada!

Yep it came from the exact same webpage you got yours from. In fact, you had to scroll past it to get to yours, you dumbfuck.New graph? Well maybe to the previously ignorant.
And that is the graph that matters. A gradual cooling for a 1000 years, then a sudden very fast rise. Just at the time that we started adding massive amounts of GHGs to the atmosphere. Just as physics predicts.

Cherry picking... How quaint... Omit the inconvenient facts that prove your fantasy wrong..New graph? Well maybe to the previously ignorant.
And that is the graph that matters. A gradual cooling for a 1000 years, then a sudden very fast rise. Just at the time that we started adding massive amounts of GHGs to the atmosphere. Just as physics predicts.

Yep. If you look at my post which shows both graphs together, you will see:Cherry picking... How quaint... Omit the inconvenient facts that prove your fantasy wrong..New graph? Well maybe to the previously ignorant.
And that is the graph that matters. A gradual cooling for a 1000 years, then a sudden very fast rise. Just at the time that we started adding massive amounts of GHGs to the atmosphere. Just as physics predicts.
Misses the fact that warming and CO2 rises, like today, have been seen before.. The only reason one would do this is to promote an agenda because it is not science... Omit previous glacial cycle ends to make it appear as if something is wrong... Only one word identifies people like old rocks... LIAR
1. That our present interglacial temperature has not exceeded the temperature range of past interglacial cycles.
2. That little uptick of the past 200 years following a declining temp that these bozo's are so fond of trotting out, is no different than any other of the saw tooth behavior profiles during the other interglacial cycles. In other words the temps will fall for a period and then swing back up. Put several of these together and they resemble a saw blade.