Vanishing Glaciers Of The Greater Himalaya - Photographic evidence

Well, Toddler, you are certainly one brain dead ass.

Simply put, every Scientific Society, every National Academy of Science, and every major University states that AGW is real, and a clear and present danger.

Of course, an ignoramous of a message board poster that presents zero evidence for his statements is supposed to convince us otherwise. LOL


And you're a brainless fool. Answer his question silly person. Why did they have to "hide the decline" then. C'mon MENSA BOY! Tell us!
 
Well, Toddler, you are certainly one brain dead ass.

Simply put, every Scientific Society, every National Academy of Science, and every major University states that AGW is real, and a clear and present danger.

Of course, an ignoramous of a message board poster that presents zero evidence for his statements is supposed to convince us otherwise. LOL

Where did the Medieval Warm Period go?
 
"Modern climate science" shouldn't have to lie if the truth is on their side.
Modern climate science doesn't have to lie. The truth is on "their side". The evidence is clear and overwhelming. You've been lied to about these supposed "lies".

It is your puppet-masters in the fossil fuel industry who are lying, to you and to the public, about the reality and dangers of AGW as they seek to keep the public confused and to prevent any effective action to limit carbon emissions and consequently their profits from selling carbon emitting fuels.

Hide the decline wasn't to perpetuate a lie?
No it wasn't. And if you had ever bothered to actually learn anything about this instead of being a propaganda parrot, you would know that.

"Hide the decline" refers to a decline in tree growth, not temperatures, at certain locations in the upper northern hemisphere since about 1960. For reasons not yet clearly understood, the spacing of tree rings, which had previously for centuries been observed to vary in a close relationship to temperatures, began to change their spacing and no longer correlated to the actual measured temperatures very well.


Then why did they want to hide it?
They didn't want to hide "it" or anything else. The tree ring divergence problem was publicly discussed in the peer-reviewed literature for fourteen years before the CRU emails were stolen in 2009. The decline in tree-ring growth was discussed openly in both in the IPCC 2001 Third Assessment Report and again more thoroughly in the 2007 Fourth Assessment Report.


Clearing up misconceptions regarding 'hide the decline'
(excerpt)
The "decline" refers to a decline in northern tree-rings, not global temperature, and is openly discussed in papers and the IPCC reports.


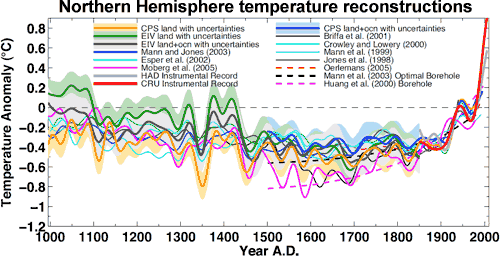
And where did the Medieval Warming Period go in the famous hockey stick chart?
It's right over there on the left. "The Medieval Warm Period (MWP)...was a time of warm climate in the North Atlantic region...lasting from about AD 950 to 1250."

NH_Temp_Reconstruction.gif


Two more independent studies back the Hockey Stick: Recent global warming is unprecedented in magnitude and speed and cause
September 21, 2010


Should we build more nuke plants, to reduce CO2?
That's one of the worst of the proposed ways to reduce CO2 emissions by switching energy systems.
 
Last edited:
Modern climate science doesn't have to lie. The truth is on "their side". The evidence is clear and overwhelming. You've been lied to about these supposed "lies".

It is your puppet-masters in the fossil fuel industry who are lying, to you and to the public, about the reality and dangers of AGW as they seek to keep the public confused and to prevent any effective action to limit carbon emissions and consequently their profits from selling carbon emitting fuels.

Hide the decline wasn't to perpetuate a lie?
No it wasn't. And if you had ever bothered to actually learn anything about this instead of being a propaganda parrot, you would know that.

"Hide the decline" refers to a decline in tree growth, not temperatures, at certain locations in the upper northern hemisphere since about 1960. For reasons not yet clearly understood, the spacing of tree rings, which had previously for centuries been observed to vary in a close relationship to temperatures, began to change their spacing and no longer correlated to the actual measured temperatures very well.


They didn't want to hide "it" or anything else. The tree ring divergence problem was publicly discussed in the peer-reviewed literature for fourteen years before the CRU emails were stolen in 2009. The decline in tree-ring growth was discussed openly in both in the IPCC 2001 Third Assessment Report and again more thoroughly in the 2007 Fourth Assessment Report.


Clearing up misconceptions regarding 'hide the decline'
(excerpt)
The "decline" refers to a decline in northern tree-rings, not global temperature, and is openly discussed in papers and the IPCC reports.


And where did the Medieval Warming Period go in the famous hockey stick chart?
It's right over there on the left. "The Medieval Warm Period (MWP)...was a time of warm climate in the North Atlantic region...lasting from about AD 950 to 1250."

NH_Temp_Reconstruction.gif


Two more independent studies back the Hockey Stick: Recent global warming is unprecedented in magnitude and speed and cause
September 21, 2010


Should we build more nuke plants, to reduce CO2?
That's one of the worst of the proposed ways to reduce CO2 emissions by switching energy systems.

For reasons not yet clearly understood, the spacing of tree rings, which had previously for centuries been observed to vary in a close relationship to temperatures,

Close relationship? Because they had real temperature readings back in 1200? That's funny.

It's right over there on the left.

Sure, on your chart, but not on Mann's.
Try again.
hockey_stick_TAR.gif

Where's the MWP?
 
Modern climate science doesn't have to lie. The truth is on "their side". The evidence is clear and overwhelming. You've been lied to about these supposed "lies".

It is your puppet-masters in the fossil fuel industry who are lying, to you and to the public, about the reality and dangers of AGW as they seek to keep the public confused and to prevent any effective action to limit carbon emissions and consequently their profits from selling carbon emitting fuels.

Hide the decline wasn't to perpetuate a lie?
No it wasn't. And if you had ever bothered to actually learn anything about this instead of being a propaganda parrot, you would know that.

"Hide the decline" refers to a decline in tree growth, not temperatures, at certain locations in the upper northern hemisphere since about 1960. For reasons not yet clearly understood, the spacing of tree rings, which had previously for centuries been observed to vary in a close relationship to temperatures, began to change their spacing and no longer correlated to the actual measured temperatures very well.


They didn't want to hide "it" or anything else. The tree ring divergence problem was publicly discussed in the peer-reviewed literature for fourteen years before the CRU emails were stolen in 2009. The decline in tree-ring growth was discussed openly in both in the IPCC 2001 Third Assessment Report and again more thoroughly in the 2007 Fourth Assessment Report.


Clearing up misconceptions regarding 'hide the decline'
(excerpt)
The "decline" refers to a decline in northern tree-rings, not global temperature, and is openly discussed in papers and the IPCC reports.


And where did the Medieval Warming Period go in the famous hockey stick chart?
It's right over there on the left. "The Medieval Warm Period (MWP)...was a time of warm climate in the North Atlantic region...lasting from about AD 950 to 1250."

NH_Temp_Reconstruction.gif


Two more independent studies back the Hockey Stick: Recent global warming is unprecedented in magnitude and speed and cause
September 21, 2010


Should we build more nuke plants, to reduce CO2?
That's one of the worst of the proposed ways to reduce CO2 emissions by switching energy systems.


20091013001556_221_chineselongevity1-6.jpg


HOLY MOTHER OF GOD...................

This nutter has been posting up the same lame-ass stuff for two years......as if it matters!!!


Hey s0n...............still waiting for those links:boobies::boobies::boobies::fu:


Asked this bozo two weeks ago to come up with a SINGLE LINK to show us how all his posted hysterical climate data garbage is resulting in ANY significant effort to reduce carbon emmissions.


yuk.............yuk..............


bomb_thrower2-2.jpg
 
Here are the real studies, their implications, and caveats.

Arbiters of Energy : Feature Articles

Now Peaches, if you read the whole study, you will find that there is 4 watts more heat escaping from IR radiation from the atmosphere, and 4 watts less reflection from the ground. That dingleberry political hack only choose to mention the heat from the atmospheric radiation, and ignored the heat that was not reflected from the ground.

A Delicate Balance: Signs of Change in the Tropics : Feature Articles

“What we found was a 4-watt-per-square-meter change within the climate system that the climate models did not predict,” says Wielicki. Over the last 15 years, without anyone’s knowledge, the amount of thermal, long-wave radiation escaping the atmosphere above the tropics increased by 4 watts per square meter. At the same time the amount of reflected sunlight, which is mostly in the form of short-wave visible and near-visible light, decreased by 4 watts per square meter. The change appears to have occurred gradually over the past decade and a half and as such was likely completely independent from El Niño (Wielicki et al. 2002). Though 4 watts of energy is only a fraction of the 342 watts per square meter of solar energy that hits the Earth’s outer atmosphere, the Earth’s energy budget is usually extremely stable over the long term, and changes of more than a couple of watts are significant.
 
Last edited:
Should we build more nuke plants, to reduce CO2?
That's one of the worst of the proposed ways to reduce CO2 emissions by switching energy systems.

Why is it bad? Zero emissions and energy that's actually there when you need it. Unlike wind and solar.

Fourth and fifth generation plants, plants that cannot melt down, would be great. They also would 'burn' the present waste. But the plants that can fail catastrophically, like Fukushima, are simply too dangerous.

The problem is cost. Nuclear has turned out to be the most expensive power. So, it will make a good base for the alternatives, but the alternatives, wind, solar, and geothermal, will be far less costly. Wind is already less costly than dirty coal. Solar is getting there. Geothermal, according to the scientists at MIT, has the best potential of all to be inexpensive, compared to nuclear.
 
Hide the decline wasn't to perpetuate a lie?
No it wasn't. And if you had ever bothered to actually learn anything about this instead of being a propaganda parrot, you would know that.

"Hide the decline" refers to a decline in tree growth, not temperatures, at certain locations in the upper northern hemisphere since about 1960. For reasons not yet clearly understood, the spacing of tree rings, which had previously for centuries been observed to vary in a close relationship to temperatures, began to change their spacing and no longer correlated to the actual measured temperatures very well.


They didn't want to hide "it" or anything else. The tree ring divergence problem was publicly discussed in the peer-reviewed literature for fourteen years before the CRU emails were stolen in 2009. The decline in tree-ring growth was discussed openly in both in the IPCC 2001 Third Assessment Report and again more thoroughly in the 2007 Fourth Assessment Report.


Clearing up misconceptions regarding 'hide the decline'
(excerpt)
The "decline" refers to a decline in northern tree-rings, not global temperature, and is openly discussed in papers and the IPCC reports.


It's right over there on the left. "The Medieval Warm Period (MWP)...was a time of warm climate in the North Atlantic region...lasting from about AD 950 to 1250."

NH_Temp_Reconstruction.gif


Two more independent studies back the Hockey Stick: Recent global warming is unprecedented in magnitude and speed and cause
September 21, 2010


Should we build more nuke plants, to reduce CO2?
That's one of the worst of the proposed ways to reduce CO2 emissions by switching energy systems.

For reasons not yet clearly understood, the spacing of tree rings, which had previously for centuries been observed to vary in a close relationship to temperatures,

Close relationship? Because they had real temperature readings back in 1200? That's funny.

It's right over there on the left.

Sure, on your chart, but not on Mann's.
Try again.
hockey_stick_TAR.gif

Where's the MWP?

Mann made that first chart with data available at the time. The further refinements made in the last few years up to present show the MWP, and continue to show the hockey stick. Do you understand that science is a continual development of theory and hypothesis, driven by data? Mann's graph was the first, like most first efforts, crude compared to later efforts. He used the data he had, and those following added more data. The result was the same, just a more ugly hockey stick.

Todd, learn a bit about how science works. From scientists, not the poltical hacks you have been quoting.
 
No it wasn't. And if you had ever bothered to actually learn anything about this instead of being a propaganda parrot, you would know that.

"Hide the decline" refers to a decline in tree growth, not temperatures, at certain locations in the upper northern hemisphere since about 1960. For reasons not yet clearly understood, the spacing of tree rings, which had previously for centuries been observed to vary in a close relationship to temperatures, began to change their spacing and no longer correlated to the actual measured temperatures very well.

In other words, he had to hide the fact that the proxies he used for temperature weren't valid during the period when he actually had temperature records. He hid the fact that his evidence is 100% bogus. The statement is more incriminating than it sounds, not less.
 
No it wasn't. And if you had ever bothered to actually learn anything about this instead of being a propaganda parrot, you would know that.

"Hide the decline" refers to a decline in tree growth, not temperatures, at certain locations in the upper northern hemisphere since about 1960. For reasons not yet clearly understood, the spacing of tree rings, which had previously for centuries been observed to vary in a close relationship to temperatures, began to change their spacing and no longer correlated to the actual measured temperatures very well.


They didn't want to hide "it" or anything else. The tree ring divergence problem was publicly discussed in the peer-reviewed literature for fourteen years before the CRU emails were stolen in 2009. The decline in tree-ring growth was discussed openly in both in the IPCC 2001 Third Assessment Report and again more thoroughly in the 2007 Fourth Assessment Report.


Clearing up misconceptions regarding 'hide the decline'
(excerpt)
The "decline" refers to a decline in northern tree-rings, not global temperature, and is openly discussed in papers and the IPCC reports.


It's right over there on the left. "The Medieval Warm Period (MWP)...was a time of warm climate in the North Atlantic region...lasting from about AD 950 to 1250."

NH_Temp_Reconstruction.gif


Two more independent studies back the Hockey Stick: Recent global warming is unprecedented in magnitude and speed and cause
September 21, 2010


That's one of the worst of the proposed ways to reduce CO2 emissions by switching energy systems.

For reasons not yet clearly understood, the spacing of tree rings, which had previously for centuries been observed to vary in a close relationship to temperatures,

Close relationship? Because they had real temperature readings back in 1200? That's funny.

It's right over there on the left.

Sure, on your chart, but not on Mann's.
Try again.
hockey_stick_TAR.gif

Where's the MWP?

Mann made that first chart with data available at the time. The further refinements made in the last few years up to present show the MWP, and continue to show the hockey stick. Do you understand that science is a continual development of theory and hypothesis, driven by data? Mann's graph was the first, like most first efforts, crude compared to later efforts. He used the data he had, and those following added more data. The result was the same, just a more ugly hockey stick.

Todd, learn a bit about how science works. From scientists, not the poltical hacks you have been quoting.

Mann needed to refine the chart to show the MWP? Didn't he know about the MWP when he made the first chart? I heard about the MWP when I was a little kid.

You'd think the only refinement would be the recent data. You know, the data he had to manipulate and trick to "hide the decline".

Maybe Mann should learn a bit about how science works. From scientists, not political hacks.
 
I love it when oldsocks pulls "skeptical science" material out of his ass...

First a bit from "skepticla science's" "about us" page.

About Skeptical Science

"About the author
Skeptical Science is maintained by John Cook, the Climate Communication Fellow for the Global Change Institute at the University of Queensland. He studied physics at the University of Queensland, Australia. After graduating, he majored in solar physics in his post-grad honours year. He is not a climate scientist. Consequently, the science presented on Skeptical Science is not his own but taken directly from the peer reviewed scientific literature. To those seeking to refute the science presented, one needs to address the peer reviewed papers where the science comes from (links to the full papers are provided whenever possible)."

I bolded the important bits.... So hes not a climate scientist, all it says is he majored in solar physics for post grad year... What is a "Climate Communication Fellow" ? Best I can find is its a climate science PR job or something like it...

So skeptical science? LOL the skeptical part is a con, there is nothing skeptical about this site, and the science part is dubious to say the least. He is a PR man plain and simple. An educated one but still a PR man...
 
For reasons not yet clearly understood, the spacing of tree rings, which had previously for centuries been observed to vary in a close relationship to temperatures,

Close relationship? Because they had real temperature readings back in 1200? That's funny.

It's right over there on the left.

Sure, on your chart, but not on Mann's.
Try again.
hockey_stick_TAR.gif

Where's the MWP?

Mann made that first chart with data available at the time. The further refinements made in the last few years up to present show the MWP, and continue to show the hockey stick. Do you understand that science is a continual development of theory and hypothesis, driven by data? Mann's graph was the first, like most first efforts, crude compared to later efforts. He used the data he had, and those following added more data. The result was the same, just a more ugly hockey stick.

Todd, learn a bit about how science works. From scientists, not the poltical hacks you have been quoting.

Mann needed to refine the chart to show the MWP? Didn't he know about the MWP when he made the first chart? I heard about the MWP when I was a little kid.

You'd think the only refinement would be the recent data. You know, the data he had to manipulate and trick to "hide the decline".

Maybe Mann should learn a bit about how science works. From scientists, not political hacks.

OK, Todd, you dumb fuck. Mann is a scientist, not a willfully ignorant ass like you. And, were you to bother reading the damned graphs, you would see that many of the later ones were done by other researchers completely independent of Mann.
 
I love it when oldsocks pulls "skeptical science" material out of his ass...

First a bit from "skepticla science's" "about us" page.

About Skeptical Science

"About the author
Skeptical Science is maintained by John Cook, the Climate Communication Fellow for the Global Change Institute at the University of Queensland. He studied physics at the University of Queensland, Australia. After graduating, he majored in solar physics in his post-grad honours year. He is not a climate scientist. Consequently, the science presented on Skeptical Science is not his own but taken directly from the peer reviewed scientific literature. To those seeking to refute the science presented, one needs to address the peer reviewed papers where the science comes from (links to the full papers are provided whenever possible)."

I bolded the important bits.... So hes not a climate scientist, all it says is he majored in solar physics for post grad year... What is a "Climate Communication Fellow" ? Best I can find is its a climate science PR job or something like it...

So skeptical science? LOL the skeptical part is a con, there is nothing skeptical about this site, and the science part is dubious to say the least. He is a PR man plain and simple. An educated one but still a PR man...

G-idiot, how would you recognize science in any case?

Can't defend your position so you cry about me again... Socks when exactly have you shown anything other than a desire to cut and paste one-sided pseudo-science?

Seriously you are a walking windpower propaganda mill, you care nothing of science, and actually know less than your average 4 year old.

You have been asked several times to explain the formula you cut and pasted in a thread recently, and as of yet you have ran from it.. You claimed or at least gave the impression you understood it, yet you run like a coward from defending it or even answering any questions about it..

Now when you actually show an ability to understand the science yourself with your opinion and your statements that you defend yourself, you can lecture to me about what you think I know or don't know.. Right now I know you are full of shit, a liar, a fraud, a phony, and have a definite ulterior motive to support this crap...
 
Last edited:
Mann made that first chart with data available at the time. The further refinements made in the last few years up to present show the MWP, and continue to show the hockey stick. Do you understand that science is a continual development of theory and hypothesis, driven by data? Mann's graph was the first, like most first efforts, crude compared to later efforts. He used the data he had, and those following added more data. The result was the same, just a more ugly hockey stick.

Todd, learn a bit about how science works. From scientists, not the poltical hacks you have been quoting.

Mann needed to refine the chart to show the MWP? Didn't he know about the MWP when he made the first chart? I heard about the MWP when I was a little kid.

You'd think the only refinement would be the recent data. You know, the data he had to manipulate and trick to "hide the decline".

Maybe Mann should learn a bit about how science works. From scientists, not political hacks.

OK, Todd, you dumb fuck. Mann is a scientist, not a willfully ignorant ass like you. And, were you to bother reading the damned graphs, you would see that many of the later ones were done by other researchers completely independent of Mann.

Yeah, he's a scientist who falsified data to "hide the decline".
A scientist who hid the MWP to make it look warmer now than it was back then.
 

Forum List

Back
Top