Navigation
Install the app
How to install the app on iOS
Follow along with the video below to see how to install our site as a web app on your home screen.

Note: This feature currently requires accessing the site using the built-in Safari browser.
More options
You are using an out of date browser. It may not display this or other websites correctly.
You should upgrade or use an alternative browser.
You should upgrade or use an alternative browser.
US tax revenue chart
- Thread starter Truthmatters
- Start date

- Feb 12, 2007
- 59,384
- 24,018
- 2,290
Government Tax and Revenue Chart: United States 1902-2015 - Federal State Local Data
The Bush tax cuts did NOT bring in more revenue did it.
How about running a report that shows receipts vs. outlays, and get back to us with some cogent and insightful commentary, preferable bereft of spelling and grammar mistakes?
Federal Budget--Receipts, Outlays, and Debt - The 2012 Statistical Abstract - U.S. Census Bureau
SniperFire
Senior Member
dear fucking idiot,
do you remember the housoing bubble based on false housing prices?
do you suggest it was the tax cuts done years before or will you face it was the housing bubble heady days that gave us that revenue?
Wait a minute.
So you admit that we DID enjoy record Federal tax receipts after the Bush tax cuts?
LOLOLOLOLOLOLOL
and we also unenjoyed a collapse of the entire world economy because of the deregulation of the lending industry.
Banks have always taken risks, but they never in world history made mindless loans to people who couldn't hope to pay them back.
What changed? Clinton forced them to do it, and greedy Wall Street saw that the gubmint was going to back him up so it was hogs to the trough on the 'too big to fail' marketplace.
If it wasn't for Clinton forever being shamed as an impeached sexual predator, this financial collapse would be his most enduring legacy.
Truthmatters
Diamond Member
- May 10, 2007
- 80,182
- 2,272
- 1,283
- Thread starter
- Banned
- #24
who the fuck is that guy and why should I trust his estimation?
- Feb 12, 2007
- 59,384
- 24,018
- 2,290
Heres a fucking clue,
SPIKES in as chart are NOT usually a good sign.
They show instability.
You want tax revenues to come in at a steady predictable level not spiking up and down like they are on crack
I'll file this under "even a broken clock is correct twice per day".
Yes, steady predictable tax receipts should be the goal of tax policy (in order to fund the proper functions of government). This is why increasing rates, expiring rates, temporary credits, tax holidays etc. are inane.
Truthmatters
Diamond Member
- May 10, 2007
- 80,182
- 2,272
- 1,283
- Thread starter
- Banned
- #26
in what year did the Bush tax cuts start?
blastoff
Undocumented Reg. User
Government Tax and Revenue Chart: United States 1902-2015 - Federal State Local Data
The Bush tax cuts did NOT bring in more revenue did it.
How about running a report that shows receipts vs. outlays, and get back to us with some cogent and insightful commentary, preferable bereft of spelling and grammar mistakes?
Federal Budget--Receipts, Outlays, and Debt - The 2012 Statistical Abstract - U.S. Census Bureau
With all due respect, boedicca, are you OUT OF YOUR FRIGG'IN MIND????
Truthmatters
Diamond Member
- May 10, 2007
- 80,182
- 2,272
- 1,283
- Thread starter
- Banned
- #28
they tanked immediately
Truthmatters
Diamond Member
- May 10, 2007
- 80,182
- 2,272
- 1,283
- Thread starter
- Banned
- #29
the republican plan of tax cuts and war will bankrupt this country
SniperFire
Senior Member
here are the FACTS for you tea party tards,
tax cuts only increase revenue is VERY extraordinary conditions.
Just ask Laffer himself
This may help...
[ame=http://youtu.be/ucoP4-06O7M]Will Higher Tax Rates Balance the Budget? - YouTube[/ame]
But.... but... isn't it just better to stick it to the greedy rich people than grow the economy?
LOL
- Feb 12, 2007
- 59,384
- 24,018
- 2,290
in what year did the Bush tax cuts start?
In what year did 9/11 happen?
In what year did the dotcom crash occur?
TakeAStepBack
Gold Member
- Mar 29, 2011
- 13,935
- 1,742
- 245
The first Bush cuts started in 2003. Notice how revenue went up, following the Clinton DOTCOM bubble burst of 2000-2001.
Then came this gem:
Then came this gem:
Truthmatters
Diamond Member
- May 10, 2007
- 80,182
- 2,272
- 1,283
- Thread starter
- Banned
- #33
oh so 911 is the cover for all the tax revenue tanking?
HMMMMMM
HMMMMMM
Truthmatters
Diamond Member
- May 10, 2007
- 80,182
- 2,272
- 1,283
- Thread starter
- Banned
- #34
Economic Growth and Tax Relief Reconciliation Act of 2001 - Wikipedia, the free encyclopedia
Income tax
EGTRRA generally reduced the rates of individual income taxes:
a new 10% bracket was created for single filers with taxable income up to $6,000, joint filers up to $12,000, and heads of households up to $10,000.
the 15% bracket's lower threshold was indexed to the new 10% bracket
the 28% bracket would be lowered to 25% by 2006.
the 31% bracket would be lowered to 28% by 2006
the 36% bracket would be lowered to 33% by 2006
the 39.6% bracket would be lowered to 35% by 2006
The EGTRRA in many cases lowered the taxes on married couples filing jointly by increasing the standard deduction for joint filers to between 174% and 200% of the deduction for single filers.
Additionally, EGTRRA increased the per-child tax credit and the amount eligible for credit spent on dependent child care, phased out limits on itemized deductions and personal exemptions for higher income taxpayers, and increased the exemption for the Alternative Minimum Tax, and created a new depreciation deduction for qualified property owners.
[edit] Capital gains tax
The capital gains tax on qualified gains of property or stock held for five years was reduced from 10% to 8% for those in the 15% income tax bracket.
Last edited:
TakeAStepBack
Gold Member
- Mar 29, 2011
- 13,935
- 1,742
- 245
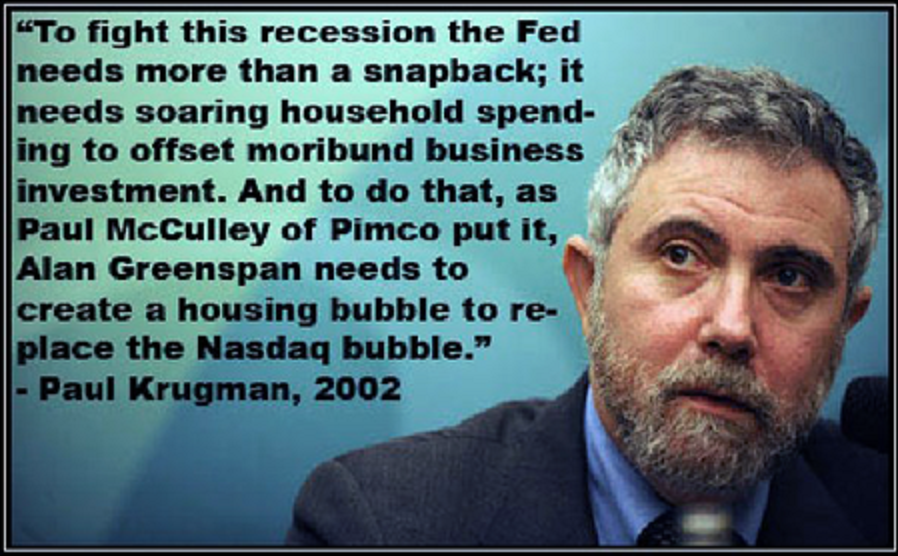
No, the NASDAQ bubble burst is responsible for that. Then Krugman recommended a housing bubble to offset the moribund investment following yet another government sponsored economic downturn.
Then in 2003, the tax cuts were enacted and federal revenue went way up. Imagine that.
Then in 2003, the tax cuts were enacted and federal revenue went way up. Imagine that.
- Feb 12, 2007
- 59,384
- 24,018
- 2,290
oh so 911 is the cover for all the tax revenue tanking?
HMMMMMM
It's a contributor to the recession of the early 2000s, you sad little sack of sophistry.
The Bush tax cuts were fully enacted after 2003, after which the economy grew quite nicely, jobs were created, and tax receipts increased...until the inevitable house of cards of the mortgage crisis fell apart.
TakeAStepBack
Gold Member
- Mar 29, 2011
- 13,935
- 1,742
- 245
And?
- Feb 12, 2007
- 59,384
- 24,018
- 2,290
The first Bush cuts started in 2003. Notice how revenue went up, following the Clinton DOTCOM bubble burst of 2000-2001.
Then came this gem:
The destruction of our currency via massive money creation means bubble after bubble after bubble. All that money seeks assets. Now, it's seeking treasuries and fueling government spending - which will be the ugliest bubble burst of all.
SniperFire
Senior Member
We are only going to extract 18% or so out of the economy in taxes.
We are a tad shy of that right now, so there is indeed room for the working classes to once again start paying their fair share of the burden.
Permit them to freeload, and they vote Democrat.
We are a tad shy of that right now, so there is indeed room for the working classes to once again start paying their fair share of the burden.
Permit them to freeload, and they vote Democrat.
Truthmatters
Diamond Member
- May 10, 2007
- 80,182
- 2,272
- 1,283
- Thread starter
- Banned
- #40
Government Tax and Revenue Chart: United States 1902-2015 - Federal State Local Data
The Bush tax cuts did NOT bring in more revenue did it.
Now look at the Clinton years and realise we never really got back to that nice steady growth because of the idiot policies of the right under Bush
Similar threads
- Replies
- 49
- Views
- 512
- Replies
- 9
- Views
- 144
- Replies
- 40
- Views
- 427
- Replies
- 23
- Views
- 225
Latest Discussions
- Replies
- 282
- Views
- 1K
- Replies
- 664
- Views
- 7K
- Replies
- 11
- Views
- 61
- Replies
- 10
- Views
- 35
Forum List
-
-
-
-
-
Political Satire 8060
-
-
-
-
-
-
-
-
-
-
-
-
-
-
-
-
-
-
-
ObamaCare 781
-
-
-
-
-
-
-
-
-
-
-
Member Usernotes 470
-
-
-
-
-
-
-
-
-
-