Tampering with TSI

SSDD

Gold Member
Nov 6, 2012
16,672
1,966
280
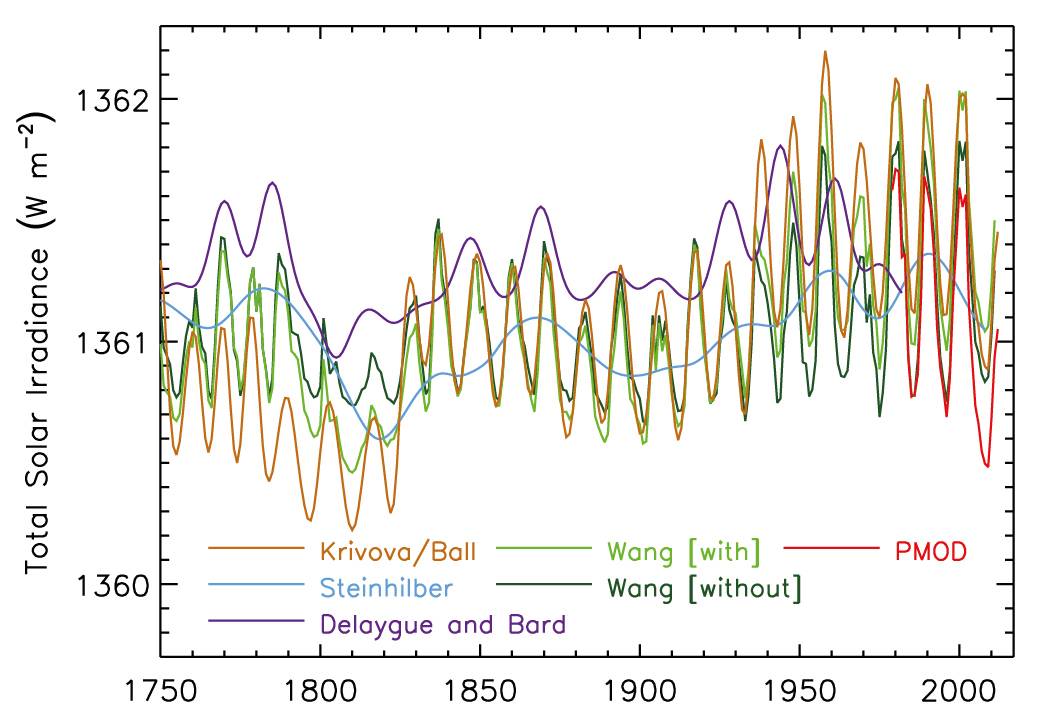
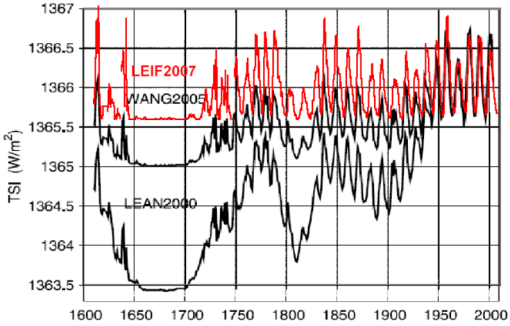
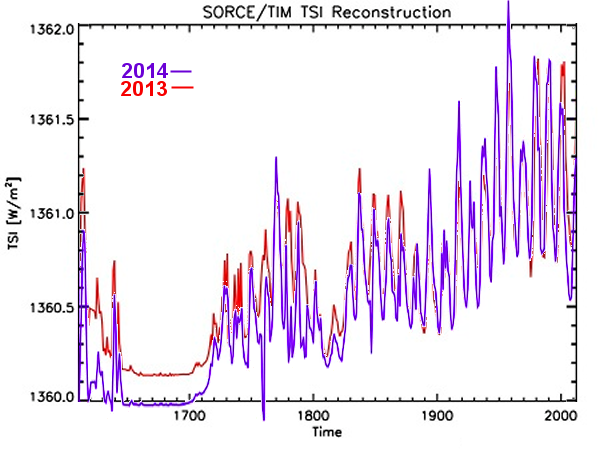
The temperature and sea level records aren't the only ones being tampered with by climate science.....TSI is getting massaged quite heavily as well. Have a look:

tsi_reconstructions.png


Here is what the SORCE TSI record looked like a month ago:

sorce_tsi_reconstruction_feb2013.png


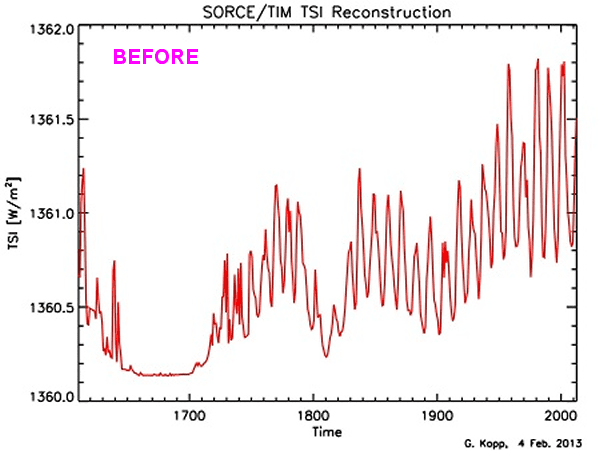
Here is what it looks like today:

sorce_tsi_reconstruction_feb2014.png


sorce_tsi_reconstruction_feb2013-feb2014.png


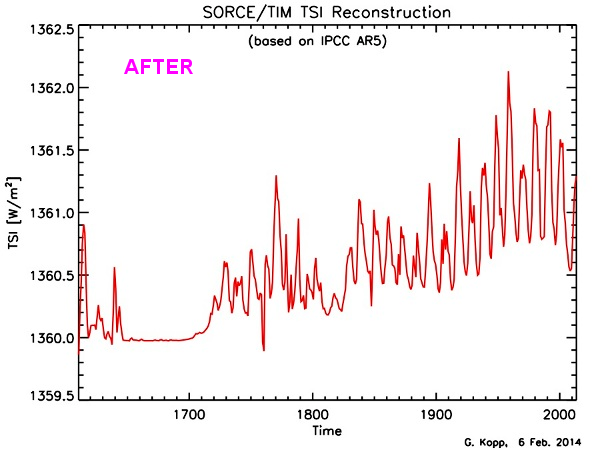
It is about time these fraudsters and charlatans are brought to account for their tinkering...the number of dollars that this sort of record tampering is diverting is making the Enron scandal look like a piggy bank caper.
 
Last edited:
You're talking about adjustments to 17th century proxy data. For god's sake, BFD. And you know changes to proxy TSI data for the last several years have been due to development in Beryllium isotope ratios as a proxy for TSI. You would have a VERY hard case to make that this was another conspiracy.

And you're one of the heavies, huh.
 
Last edited:
You're talking about adjustments in the 17th century. For god's sake, BFD.

You really can't read a graph, can you? Look at the right side of the graph, idiot...and then tell me again that you can't see the adjustments. Both Ian and Flcalten have pointed out repeatedly that you can't read a graph further highlighting your lack of education regardless of your claims....now you are saying that as an engineer you can't see the adjustments on these graphs either? I am laughing in your face abraham....laughing out loud blowing my cornflakes all over the place. How much more of an admission that you are not educated could you possibly make?

What you are unable to see due to your lack of education is that nearing the end of the 20th century TSI was at its highest point for hundreds of years....they have reduced that number considerably.....perhaps to claim that the sun was not responsible for the warming in the latter years of the 20th century? The fraud never ends with these people.
 
Last edited:
Ever since deniers Christy and Spencer at the UAH got caught manipulating the satellite data, the Right have been trying to muddy the water by accusing every and their cousin of tampering with the data.
 
Ever since deniers Christy and Spencer at the UAH got caught manipulating the satellite data, the Right have been trying to muddy the water by accusing every and their cousin of tampering with the data.

Accusations that the evidence keeps corroborating.
 
this was one of the first areas I looked into when I got interested in global warming. I cannot remember if it was Lean or Willson that complained bitterly about how her work was not being accepted until it conformed to the wishes of the lead IPCC authors. there is always a lot of slack in the numbers when satellites are involved.
 
this was one of the first areas I looked into when I got interested in global warming. I cannot remember if it was Lean or Willson that complained bitterly about how her work was not being accepted until it conformed to the wishes of the lead IPCC authors. there is always a lot of slack in the numbers when satellites are involved.

The fact that TSI was at its highest point for nearly a thousand years during the later years of the 20th century was becoming quite well known and bolstering the idea that the sun was actually in control of our climate, not CO2....therefore the sun and its effect on climate must be silenced....

The tampering worked so well with the temperature record, surely it will work as well on the TSI record.


as I see it.... the main problem with TSI, and its various components, is the neutral point. at what level of TSI should we expect no warming or cooling? I have said here several times that just because the flame under the pot of water is not increasing that does not mean the water is not getting warmer. the CAGW enthusiasts claim that TSI during the 20th century was not the cause of warming but I cannot see how they can be so sure.
 
Beryllium isotope deposits in ice cores and other dated sediment give pretty good measurements of TSI. I don't think anyone is claiming absolute certainty, but that's how they can have the level of certainty they're actually claiming.
 
You can't explain the Maunder Minimum surface temp evidence with that little change in TSI..
The monkeys are on full shifts working over the incline. More important to me is the IPCC habitually LYING about the solar forcings in their summaries. They INVENT new definitions for TSI to cloud the issue. All you got to do to monkey with it is to give MORE WEIGHT to sunspot number than those Isotope measurements that Abe is bellowing about. The warmer deflection is ALWAYS to confuse sunspot numbers as a proxy for TSI. It ALWAYS results in a flat baseline chart.

Last report had the increase from 1750s at some ridiculous low number like 0.05W/m2.. NO ONE can monkey like UN monkeys...
 
The only term I capitalized was "TSI". I hardly think that could be accurately characterized as "bellowing".

Nor would it be appropriate to charge the IPCC, who has taken a different and more widely supported conclusion concerning the radiative forcing factor of TSI over the pertinent time span than have you, with lying. But, hey, why don't we go have a look through AR5 and see what they say about TSI.
 
If SSDD is going to parrot WUWT, he should at least link to it.

Historical and present Total Solar Irradiance has been tinkered with again | Watts Up With That?

So one set of graphs has year 1700 TSI being adjusted up, and the other has it adjusted down. Opposite ways. Kind of disproves the conspiracy, given the conspirators can't seem to make up their minds.

If you read the comments on the WUWT thread, even former fave denialist scientist Scafetta is calling BS on it. Which leads to poor Scafetta being attacked by everyone. That's the problem with being a denialist. It's solely about the politics, and you quickly get defined as "the enemy" if you disagree with the in-crowd. Svaalgard is kind of a DearLeader there, Scafetta disagreed with Svaalgard, so Scafetta is now demonized.
 
Last edited:
If SSDD is going to parrot WUWT, he should at least link to it.

Historical and present Total Solar Irradiance has been tinkered with again | Watts Up With That?

So one set of graphs has year 1700 TSI being adjusted up, and the other has it adjusted down. Opposite ways. Kind of disproves the conspiracy, given the conspirators can't seem to make up their minds.

If you read the comments on the WUWT thread, even former fave denialist scientist Scafetta is calling BS on it. Which leads to poor Scafetta being attacked by everyone. That's the problem with being a denialist. It's solely about the politics, and you quickly get defined as "the enemy" if you disagree with the in-crowd. Svaalgard is kind of a DearLeader there, Scafetta disagreed with Svaalgard, so Scafetta is now demonized.

You missed an important lesson there cat.. At least OUR scientific feuds are in the open.. Not hidden in private emails and "enemies lists"...

Thanks for tip on the cat fight. I do enjoy me a good spat..

That's the difference between thinking people and lock step drones like the warmist wackos.
 
In your quest to attack personalities (a denialist trait), you two neglected to explain how TSI being adjusted in two different directions proves a conspiracy, when it would seem to indicate the opposite. I take it you're abandoning the crazy conspiracy claims now?
 
I have transcribed the accompanying text by hand since the PDF is protected. However, before you start reading, you might examine these data to see if they show ANYTHING like a sufficient increase in TSI to have driven the warming of the last 150 years, complex delays or no.

This is Figure 8.11 from AR5, WG I, The Physical Science Basis.
WGI_AR5_Fig8-11.jpg


A transcription.

8.4.1.2 Total Solar Irradiance Variations Since Preindustrial Times

The year 1750, which is used as the preindustrial reference for estimating RF, corresponds to a maximum of the 11-year SC. Trend analysis are usually performed over the minima of the solar cycles that are more stable. For such trend estimates, it is then better to use the closest SC minimum, which is in 1745. To avoid trends caused by comparing different portions of the solar cycle, we analyze TSI changes using multi-year running means. For the best estimate we use a recent TSI reconstruction by Krivova et al (2010) between 1745 and 1973 and from 1974 to 2012 by Ball et al (2012). The reconstruction is based on physical modeling of the evolution of solar surface magnetic flux and its relationship with sunspot group number (before 1974) and sunspot umbra and penumbra and faculae afterwards. This provides a more detailed reconstruction than other models (see the time series in Supplementary Material Table 8.SM.3). The best estimate from our assessment of the most reliable TSI reconstruction gives a 7-year running mean RF between the minima of 1745 and 2008 of 0.05Wm^-2. Our assessment of the range of RF from TSI changes is 0.0 to 0.10 Wm^-2 which covers several updated reconstructions using the same 7-year running mean past-to-present minima years (Wang et al, 2005; Steinhilber et al, 209; Delaygue and Bard, 2011), see Supplementary Material Table 8.SM.4. All reconstructions rely on indirect proxies that inherently do not give consistent results. There are relatively large discrepancies among the models (See Figure 8.11). With these considerations, we adopt this value and range for AR5. This RF is almost half of that in AR4, in part because the AR4 estimate was based on the previous solar cycle minimum while the AR5 estimate includes the drop of TSI in 2008 compared to the previous two SC minima (see 8.4.1). Concerning the uncertainty range in AR4 the upper limit corresponded to the reconstruction of Lean (2000), based on the reduced brightness of non-cycling Sun-like stars assumed typical of a Maunder minimum (MM) state. The use of such stellar analogues was based on the work of Bailunas and Jastrow (1990), but more recent surveys have not reproduced their results and suggest that the selection of the original set was flawed (Hal and Lockwood, 2004; Wright, 2004); the lower limit from 1750 to present in AR4 was due to the assumed increase in the amplitude of the 11-year cycle only. Thus the RF and uncertainty range have been obtained in a different way in AR5 compared to AR4. Maxima to maxima RF give a higher estimate than minima to minima RF, but the latter is more relevant for changes in solar activity. Given the medium agreement and medium evidence, this RF value has a medium confidence level (although confidence is higher for the last three decades). Figure 8.11 shows several TSI reconstructions modeled using sunspot group numbers (Wang et al, 2005; Krivova et al, 2010; Ball et al, 2012) and sunspot umbra and penumbra and faculae (Ball et al, 2012) or cosmogenic isotopes (Steinhilber et al, 2009; Delaygue and Bard, 2011). These reconstructions are standardized to PMOD SC 23 (1996-2008) (see also Supplementary Material Section 8.SM.6).

For the MM-to-present AR4 gives a TOA instantaneous RF range of 0.1 to 0.28 Wm^-2, equivalent to 0.08 to 0.22 Wm^-2 with the RF definition used here. The reconstructions in Schmidt et al (2011 indicate a MM-to-present RF range of 0.08 to 0.18 Wm^-2, which is within the AR4 range although narrower. As discussed above, the estimates based on irradiance changes in Sun-like stars are not included in this range because the methodology has been shown to be flawed. A more detailed explanation of this is found in Supplementary Material Section 8.SM.6. For details about TSI reconstructions on millenia times scales see Section 5.2.1.2.
 
Last edited:
In your quest to attack personalities (a denialist trait), you two neglected to explain how TSI being adjusted in two different directions proves a conspiracy, when it would seem to indicate the opposite. I take it you're abandoning the crazy conspiracy claims now?

Idiot, the only adjustments that really matter are those made to the latter part of the 20th century.
 
In your quest to attack personalities (a denialist trait), you two neglected to explain how TSI being adjusted in two different directions proves a conspiracy, when it would seem to indicate the opposite. I take it you're abandoning the crazy conspiracy claims now?

It's not the SORCE/TIM changes that I'm concerned about.. Those folks have always been mainstream. It's the original graph below.
This includes redefinitions of TSI and assumptions that are not mainstream and related to the IPCC efforts to absolutely UNDERstate the TSI..


tsi_reconstructions.png


Those later studies are DESIGNED to distort...
 
It's the original graph below.
This includes redefinitions of TSI and assumptions that are not mainstream and related to the IPCC efforts to absolutely UNDERstate the TSI..

Those later studies are DESIGNED to distort...

Let's see your evidence.
 
Here is the core of the explanation for the changing TSI analyses in the AR5, WG I quoted above.

This RF is almost half of that in AR4, in part because the AR4 estimate was based on the previous solar cycle minimum while the AR5 estimate includes the drop of TSI in 2008 compared to the previous two SC minima (see 8.4.1). Concerning the uncertainty range in AR4 the upper limit corresponded to the reconstruction of Lean (2000), based on the reduced brightness of non-cycling Sun-like stars assumed typical of a Maunder minimum (MM) state. The use of such stellar analogues was based on the work of Bailunas and Jastrow (1990), but more recent surveys have not reproduced their results and suggest that the selection of the original set was flawed (Hal and Lockwood, 2004; Wright, 2004); the lower limit from 1750 to present in AR4 was due to the assumed increase in the amplitude of the 11-year cycle only. Thus the RF and uncertainty range have been obtained in a different way in AR5 compared to AR4. Maxima to maxima RF give a higher estimate than minima to minima RF, but the latter is more relevant for changes in solar activity. Given the medium agreement and medium evidence, this RF value has a medium confidence level (although confidence is higher for the last three decades).

Care to refute any of that?

But first, show us the evidence that supports your charges that the IPCC intended to understate (ie lie about) TSI and that the later studies on TSI reconstruction were "designed to distort".
 
Last edited:

Forum List

Back
Top