Billy_Bob
Diamond Member
- Thread starter
- #21
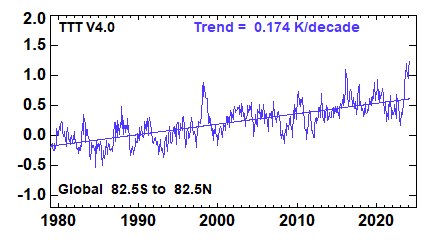
Well, no shit sherlock! We're coming out of a mega nino and this is typical. Still we're likely to have another warmest June on record based on the giss and noaa data set!!! Hell, the way the data the past week has been going we could start July out like this.
1998 also crashed like this! We're very likely going to have the 3rd warmest year on record in a roll. hahaha.
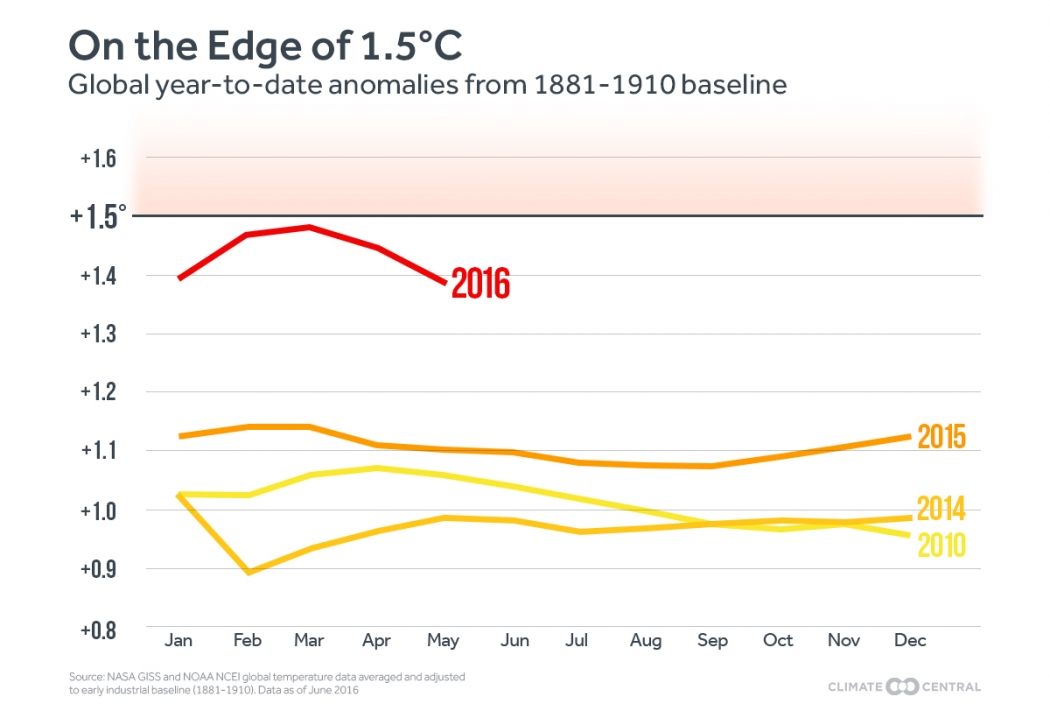
Leave it to breathless Mathew to misrepresent how hot it was... When we adjust for El Niño effects it was just 0.10 deg C above the 30 year average.. Nothing to write home about..