NOAA USHCN temperature data adjustments completely justified

Crick

Gold Member
May 10, 2014
27,986
5,338
290
N/A
http://www-users.york.ac.uk/~kdc3/papers/crn2016/CRN Paper Revised.pdf

Abstract
Numerous inhomogeneities including station moves, instrument changes, and time of observation changes in the U.S. Historical Climatological Network (USHCN) complicate the assessment of long-term temperature trends. Detection and correction of inhomogeneities in raw temperature records have been undertaken by NOAA and other groups using automated pairwise neighbor-comparison approaches, but these have proven controversial due to the large trend impact of homogenization in the United States. The new U.S. Climate Reference Network (USCRN) provides a homogenous set of surface temperature observations that can serve as an effective empirical test of adjustments to raw USHCN stations. By comparing nearby pairs of USHCN and USCRN stations, we find that adjustments make both trends and monthly anomalies from USHCN stations much more similar to those of neighboring USCRN stations for the period from 2004-2015 when the networks overlap. These results improve our confidence in the reliability of homogenized surface temperature records.

This paper in its entirety is available at the link.

Conclusions
During the period of overlap between the USHCN and USCRN networks, we can confidently conclude that the adjustments to the USHCN station records made them more similar to proximate homogenous USCRN station records, both in terms of trends and anomalies. There are no systematic trend biases introduced by adjustments during this period; if anything adjusted USHCN stations still underestimate maximum (and mean) temperature trends relative to USCRN stations. This residual maximum temperature bias warrants additional research to determine the exact cause. While this analysis can only directly examine the period of overlap, the effectiveness of adjustments during this period is at least suggestive that the PHA will perform well in periods prior to the introduction of the USCRN, though this conclusion is somewhat tempered by the potential changing nature of inhomogeneities over time. This work provides an important empirical test of the effectiveness of temperature adjustments similar to Vose et al. [2012], and lends support prior work by Williams et al [2012] and Venema et al [2012] that used synthetic datasets to find that NOAA’s pairwise homogenization algorithm is effectively removing localized inhomogeneities in the temperature record without introducing detectable spurious trend biases.
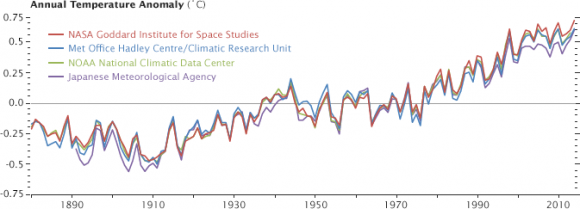
 
The impact of adjustments on the global record are scientifically inconsequential.
Berkeley Earth: raw versus adjusted temperature data

"In summary, it is possible to look through 40,000 stations and select those that the algorithm has warmed; and, it’s possible to ignore those that the algorithm has cooled. As the spatial maps show it is also possible to select entire continents where the algorithm has warmed the record; and, it’s possible to focus on other continents were the opposite is the case. Globally however, the effect of adjustments is minor. It’s minor because on average the biases that require adjustments mostly cancel each other out."
 
The similarities between GISS, Hadley, JMA and NCDC show that science works and that these measurements are valid and as accurate as possible.

nasa-noaa-metoffice-japan-temperature-record-e1430236318885.png

Why do global temperature records differ? | EarthSky.org
 
Zeke Hausfather, Energy and Resources Group, University of California
Berkeley, Berkeley

LOL.. This explains a lot..

Zeke is known for not so science info..

Case in point;
"However, the net effect of adjustments on the USHCN is quite large, effectively doubling the mean temperature trend over the past century compared to the raw observational data [Menne et al 2009]."

Menne acknowledged that the adjustments were all one way to warming and that they were most likely, heavily biased. But Zeke failed to mention that...
 
The fact that all adjustments are one way defies the laws of probability and of temporal distribution. I call Bull Shit!


But they most certainly are NOT all one way. See this link which was posted above. Berkeley Earth: raw versus adjusted temperature data
though this conclusion is somewhat tempered by the potential changing nature of inhomogeneities over time.

LOL..This means we don't have a clue what will happen next and our pool of homogenization is without merit...

The OP link provides a clear explanation of the value of homogenization and since this is a warming of "POTENTIAL"ly changing inhomogeneities, your conclusion is not supported.
 
They didn't give any reason for altering temperatures taken 50, 60, and even 100 years ago...why do you suppose they might have done that?? Certainly not location changes...or instrument changes...

The only rational reason for doing so is to alter the appearance of a modern trend...cool the past and the present looks warmer..as if that is rational..but then we are talking about the mechanizations of a glassy eyed chanting cult.
 
Menne acknowledged that the adjustments were all one way to warming and that they were most likely, heavily biased. But Zeke failed to mention that...

Here is the conclusion of Menne 2009.

SUMMARY AND CONCLUSIONs. Overall, the collective effect of changes in observation practice at U.S. HCN stations is of the same order of magnitude as the background climate signal (e.g., artificial bias in maximum temperatures is about −0.04°C decade−1 compared to the background trend of about 0.06°C decade−1). Consequently, bias adjustments are essential in reducing the uncertainty in U.S. climate trends. The bias changes that have had the biggest effect on the climate network as a whole include changes to the time of observation (which affects both maximum and minimum temperature trends) and the widespread conversion to the MMTS (which affects primarily maximum temperatures). Adjustments for undocumented changes are especially important in removing bias in minimum temperature records. Tests for undocumented shifts, however, are inherently less sensitive than in cases where the timing of changes is known through metadata. Thus, metadata are exceedingly valuable when it comes to adjusting and evaluating climate trends. Trends in the HCN version 2 adjusted series are more spatially uniform than in unadjusted data. This indicates that the homogenization procedures remove changes in relative bias and that the background climate signal is more accurately represented by the homogenized data. It is important to point out, however, that although homogenization generally ensures that climate trends can be more confidently intercompared between sites, the effect of relative biases will still be reflected in the mean temperatures of homogenized series. The reason is that, by convention, temperatures are adjusted to conform to the latest (i.e., current) observing status at all stations. This detail helps to explain why Peterson and Owen (2005) found evidence of a systematic difference in mean temperatures at rural versus urban HCN stations but little evidence of a comparable difference in their homogenized trends. Moreover, while changes in observation practice have clearly had a systematic effect on average U.S. temperature trends, homogeneity matters most at the station level where even one change in bias can have a drastic effect on the series trend (which can occasionally be missed by changepoint tests). Therefore, the goal behind the HCN version 2 dataset (and future improvements) is to make the adjustments as site specific and comprehensive as possible, which is especially valuable in the development of widely used products, such as the U.S. Climate Normals. Finally, the U.S. HCN data will be updated monthly and fully reprocessed periodically to detect and adjust for shifts from the recent past (see www. ncdc.noaa.gov/oa/climate/research/uschcn/ for further information, including access to the data and uncertainty calculations). Plans are also in place to ensure that U.S. HCN monthly means are internally consistent with NCDC’s global daily dataset (the Global Historical Climatology Network—Daily dataset). Still, there is always room for improvement in the field of climate data homogenization. For example, although the monthly adjustments used in HCN version 2 are constant for all months, there is evidence that bias changes often have effects that vary seasonally and/or synoptically (Trewin and Trivitt 1996; Guttman and Baker 1996). As shown by Della-Marta and Wanner (2006), it is possible to estimate the differential effects indirectly by evaluating the magnitude of change as a function of the frequency distribution of daily temperatures. Daily adjustments are thus a promising area for future HCN development.

Show us where he even suggests that "adjustments were all one way to warming". Here is a link to the full paper if you think the comment was to be found elsewhere. http://journals.ametsoc.org/doi/pdf/10.1175/2008BAMS2613.1
 
I find it interesting that a thread devoted to the topic that has defined the denier central thesis should go so untouched.
 
From Hadley's FAQ

Why are values slightly different when I download an updated file a year later?
All the files on this page (except Absolute) are updated on a monthly basis to include the latest month within about four weeks of its completion. Updating includes not just data for the last month but the addition of any late reports for up to approximately the last two years. Every year, we also add in updated data for stations that do not report in real time, by using station data that we access from NMSs around the world. This addition takes place around May or Junes each year, as by then sufficient NMSs will have made their monthly average data available for the preceding year. Where available, we add in extra data from some NMSs when they make more homogeneous data available. The routine annual updates include data from the USA, Canada, Russia, Australia and a number of European countries.

In addition to this the method of variance adjustment (used for CRUTEM4v) works on the anomalous temperatures relative to the underlying trend on an approximate 30-year timescale. With the addition of subsequent years, the underlying trend will alter slightly, changing the variance-adjusted values. Effects will be greatest on the last year of the record, but an influence can be evident for the last three to four years. Full details of the variance adjustment procedure are given in Jones et al. (2001).


Can scientists use the data as is?


No. To understand why not, imagine you're a nurse checking a patient's chart. You find the following temperature readings (Fahrenheit) for the last few hours: 99.2, 99.8, 1000, 101.4. You'd know immediately that the third number was a mistake. To make a realistic assessment of the patient's condition, you'd have to either adjust it or throw it out.

Weather observers are as human as nurses, and they also make occasional mistakes in recording and transcribing their observations: impossibly high highs and low lows, the exact same temperatures for two months in a row, etc. The first step in data processing is quality control: identifying and eliminating erroneous data.


Once the mistakes are eliminated, are the data ready to use?


Not yet. They have to be adjusted to account for all the changes that happen over time:

• The landscape has changed dramatically in the last 100-150 years. Villages have become cities; roads have been paved; trees have been planted and cut down.

• The observers have changed. Weather watchers have retired and been replaced by people living uphill, downhill or across town.

• Daily times of observation have changed.

• The technology has changed. Mercury-in-glass thermometers have been replaced by more modern systems. Broken instruments have been replaced by new ones whose readings may not be perfectly consistent.

None of these changes has anything to do with climate, but they all leave a mark on temperature data. Some changes are known to raise temperatures, like urbanization; others are known to lower them, like the change from liquid-in-glass thermometers to maximum/minimum temperature systems. If these biases are not compensated for, we cannot understand how the climate itself is changing.

How do scientists deal with these changes?

Major climate research organizations worldwide have developed mathematically rigorous, peer-reviewed data processing methods to identify and compensate for changes in observing conditions. Since the research groups are independent, they do not use exactly the same techniques. One example is the way two U.S. research institutions deal with a well-known problem, the urban heat island effect — the fact that cities are warmer than the surrounding countryside. NASA's Goddard Institute for Space Studies (GISS) addresses this problem using satellite images of nighttime lights to classify stations as urban, near-urban or rural, then compares the urbanized records with an average of nearby rural stations to calculate the extent by which urbanization has warmed the data. NCDC, in processing station data for its U.S. climate divisional dataset (nClimDiv) and Global Historical Climatology Network (GHCN), corrects for the urban heat island effect and other changes such as station moves by using a technique that compares each station with multiple neighboring stations to find "guilty" stations and calculate the magnitude of necessary corrections.

Overviews of the data-processing techniques for NCDC's nClimDiv and GHCN are available here and here. GISS's data analysis methods, with links to papers giving full scientific explanations, are described here.

Hadley Centre/Climatic Research Unit of the University of East Anglia (CRU) and the Australian Bureau of Meteorology are peer reviewed, as mentioned above, and the processed data sets have undergone many peer-reviewed analyses as well.

An independent nonprofit organization called Berkeley Earth, funded by educational grants, has devised its own data processing techniques to deal with the changes listed above. Again, the results are very similar to results from NCDC, GISS and the CRU.


Does data processing make temperature data warmer?


It can go either way. Almost half of NOAA's corrected data are cooler than the original records. NOAA's corrections of temperatures over the oceans — done to compensate for changes in methods of observing the temperature of water at the surface of the ocean — reduced the warming trend in global temperature.


Does data processing destroy the original data?


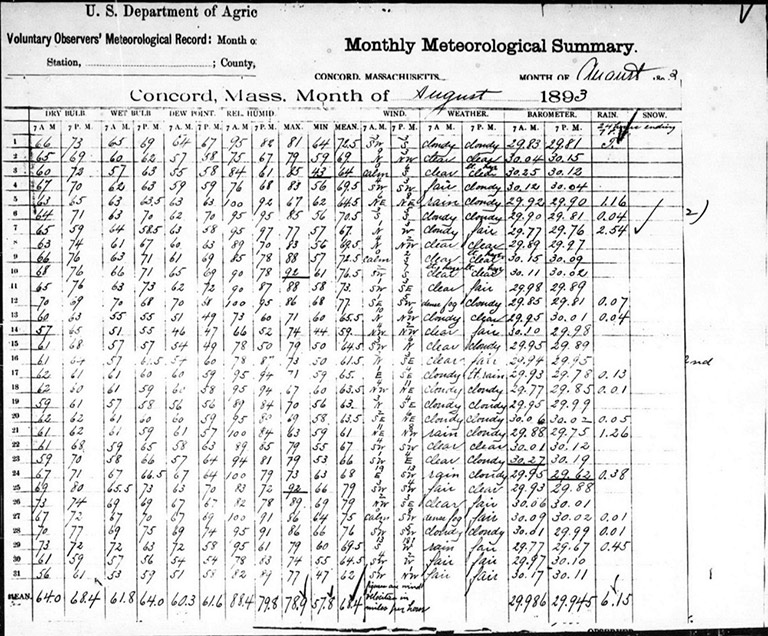
443_Concord-Aug-1893-768px-67.jpg

An example of the original weather and climate records archived at NCDC. Station records like this one are available here.

No, the original records are preserved and are available at no cost online. You can access NCDC's U.S. and global records here.


For more technical answers on this topic, visit GISS's FAQs and NCDC's FAQs.

Climate Change: Vital Signs of the Planet: Questions (FAQ)
 
lol.....thread calls to mind an old adage I remember as a kid...........

Does a bear shit in the woods?

Not surprising that Crick never heard that one!!!

Like the NOAA is going to come out and state, "Yeah well.........we had to rig the data because otherwise the results wouldn't conform with the established narrative!" :bye1::bye1:

You forgot to mention that at the time, the only way to keep the money rolling in was to march in lockstep with the established narrative.
 
That same comment could be said about any branch of science, many of which involve much more expensive research than climate work. Surely you must believe that the LHC was put together just as a money-making scheme by all those physicists involved. Yes? Way, way more expensive than collecting weather station data over the internet and chugging away on your PC for a few days.
 
Same Shit, what keeps those LHC physicists honest? Why aren't they making things up just to make money? Who the hell would know?
 

Forum List

Back
Top