centrifuge
Rookie
- Aug 16, 2015
- 22
- 1
- 1
at first refreshing.... a moderating effect the breeze borne sensation ...come from the four winds, O breath, and breathe upon these slain. EZEY
Follow along with the video below to see how to install our site as a web app on your home screen.

Note: This feature currently requires accessing the site using the built-in Safari browser.
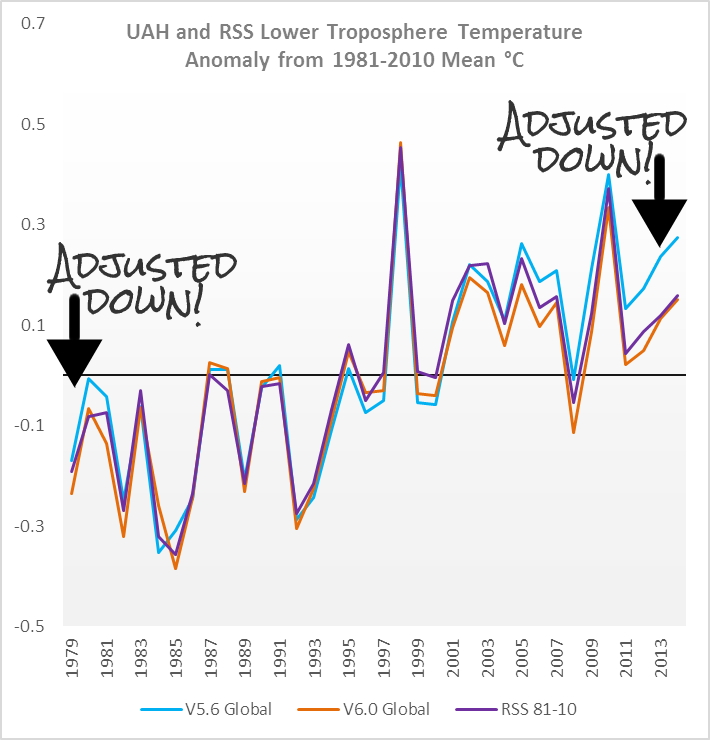
You just want to keep playing dumb rather than admit Spencer and Christy are up to their old tricks of cooking the data. As I pointed out Spencer admitted in 2011 that the RSS data was artificially LOW, and now he has fudged his UAH data so it is LOWER than RSS.That is NOT v6.0, that is v5.6. You are not smart enough to deceive me, there Slick!Even Spencer has admitted that the RSS data UNDERESTIMATES global temperature, and now with his v6.0 his fudged numbers are cooler than RSS.There is no continuing "scandal" surrounding the VERY SMALL adjustment and error that you are referring to. That happened a long time ago now and both satellite records UAH and RSS have been extremely stable for decades. Can't believe the # of folk who want to impeach space science in favor of 100,000 thermometers with big gaps in the coverage.
UAH and RSS track a lot better together than the cooked GISS and Hadley data...
Anyway, my UAH cohort and boss John Christy, who does the detailed matching between satellites, is pretty convinced that the RSS data is undergoing spurious cooling because RSS is still using the old NOAA-15 satellite which has a decaying orbit, to which they are then applying a diurnal cycle drift correction based upon a climate model, which does not quite match reality.
-Roy Spencer, 2011
Everything in temperature measurement that USED have generally good agreement is diverging. But from the chart below.. Either UAH is ADDING warming or Dr Roy's comments above might be correct..

What you DON'T have in the satellite record is CONTINUOUS wholesale adjustments of historical value by DATE that truly seem to want to hockey stick the fuck out of the raw data. When UAH or RSS is updated -- it is generally uniformly updated over the whole 40 year time span. With the exception of orbital issues like what might be appearing above..
Good job. Version 6. just released this month.. The differences are miniscule for a GLOBAL result. If you read the detailed description of the changes it comes from regional differences due to geometry corrections for the new methodology. Some regions up -- other down. The difference chart is on the order 0.12 MAX for the entire freaking globe !!! And the difference to the decadal trend rate is 0.02deg/decade.
Version 6.0 of the UAH Temperature Dataset Released: New LT Trend = +0.11 C/decade « Roy Spencer, PhD
UAH NEW results end the discrepancy with RSS --- you should be thrilled. Better result since they both use the same satellite resources AND --- UAH EXPLAINS the adjustments.. Go fetch me the GISS description of their adjustments and WHY they occur CONSTANTLY to 1930's data.. Go fix THAT divergence with the sat record now..
They'll eventually tell you that "expert interpretation" is required for most of their "data creation" to fill in the reporting gaps.
Would MUCH rather correct for a fleet of 12 satellites that cover more area more consistently -- than 100,000 thermometers with random surface coverage..
Just to refresh your faulty memory:
Anyway, my UAH cohort and boss John Christy, who does the detailed matching between satellites, is pretty convinced that the RSS data is undergoing spurious cooling because RSS is still using the old NOAA-15 satellite which has a decaying orbit, to which they are then applying a diurnal cycle drift correction based upon a climate model, which does not quite match reality.
-Roy Spencer, 2011

Oh my, we are still cooling. Yessireeeeeeeeeeeeee Bob!
temperature trend for El Niño, La Niña and neutral years, up to 2013, based on NASA GISS dataset.
Two hottest years ever: 2014 will set new world temperature record – and 2015 will break it
No it didn't, you just make that shit up. UAH does not use the satellite RSS uses that is drifting.You just want to keep playing dumb rather than admit Spencer and Christy are up to their old tricks of cooking the data. As I pointed out Spencer admitted in 2011 that the RSS data was artificially LOW, and now he has fudged his UAH data so it is LOWER than RSS.That is NOT v6.0, that is v5.6. You are not smart enough to deceive me, there Slick!Even Spencer has admitted that the RSS data UNDERESTIMATES global temperature, and now with his v6.0 his fudged numbers are cooler than RSS.
Anyway, my UAH cohort and boss John Christy, who does the detailed matching between satellites, is pretty convinced that the RSS data is undergoing spurious cooling because RSS is still using the old NOAA-15 satellite which has a decaying orbit, to which they are then applying a diurnal cycle drift correction based upon a climate model, which does not quite match reality.
-Roy Spencer, 2011
Everything in temperature measurement that USED have generally good agreement is diverging. But from the chart below.. Either UAH is ADDING warming or Dr Roy's comments above might be correct..
What you DON'T have in the satellite record is CONTINUOUS wholesale adjustments of historical value by DATE that truly seem to want to hockey stick the fuck out of the raw data. When UAH or RSS is updated -- it is generally uniformly updated over the whole 40 year time span. With the exception of orbital issues like what might be appearing above..
Good job. Version 6. just released this month.. The differences are miniscule for a GLOBAL result. If you read the detailed description of the changes it comes from regional differences due to geometry corrections for the new methodology. Some regions up -- other down. The difference chart is on the order 0.12 MAX for the entire freaking globe !!! And the difference to the decadal trend rate is 0.02deg/decade.
Version 6.0 of the UAH Temperature Dataset Released: New LT Trend = +0.11 C/decade « Roy Spencer, PhD
UAH NEW results end the discrepancy with RSS --- you should be thrilled. Better result since they both use the same satellite resources AND --- UAH EXPLAINS the adjustments.. Go fetch me the GISS description of their adjustments and WHY they occur CONSTANTLY to 1930's data.. Go fix THAT divergence with the sat record now..
They'll eventually tell you that "expert interpretation" is required for most of their "data creation" to fill in the reporting gaps.
Would MUCH rather correct for a fleet of 12 satellites that cover more area more consistently -- than 100,000 thermometers with random surface coverage..
Just to refresh your faulty memory:
Anyway, my UAH cohort and boss John Christy, who does the detailed matching between satellites, is pretty convinced that the RSS data is undergoing spurious cooling because RSS is still using the old NOAA-15 satellite which has a decaying orbit, to which they are then applying a diurnal cycle drift correction based upon a climate model, which does not quite match reality.
-Roy Spencer, 2011
BY the way Version 6.0 corrected for that drift... and we are still cooling..
No it didn't, you just make that shit up. UAH does not use the satellite RSS uses that is drifting.
RSS is still using the old NOAA-15 satellite which has a decaying orbit, to which they are then applying a diurnal cycle drift correction based upon a climate model, which does not quite match reality. We have not used NOAA-15 for trend information in years…we use the NASA Aqua AMSU, since that satellite carries extra fuel to maintain a precise orbit.
- Roy Spencer, 2011
What happened to the 0.5 deg/decade that Hansen predicted to Congress in 1988.. He was only off by a factor of 5
and if you did that with all the cities in the world, you most likely would get more than 50% that are like this analogy. Even alaska. you know, the place it was the warmest, except for where the records are kept.Once more we see Mr. Westwall lying. No, worldwide, the 1930's are not the warmest time on record. That last 17 years are the warmest time on record. NOAA, NASA, the Japanese Meteorological Agency, and every other modern nations meteorological agencies say so. But we are supposed to believe flap yap rightwingnut ideologues on the internet.July was the hottest month in Earth’s hottest year on record so far
Conservatives will now talk about cherrypicked local places within the United States where it wasn't so hot.
It's what they do. They go local.
Really? On which planet is that? According to the historical temperature record this July has been very mild. In my region we have had no days over 100 degree's which hasn't happened in decades. By far the hottest time on record is the 1930's.
You are spewing nothing but propaganda. Sad that you are too stupid to believe it...
Umm, yeah they are. I dare you to look at the local records little blowhard. Here is Finland. Wow, look at all those records from the 1930's! Your problem is you have been lying for so long you no longer know how o even do basic research....
The top years
Helsinki: 1934, 2000 / 7.2 degrees
Stockholm: 1934, 2000 / 7.8 degrees
Uppsala: 1934 (no comparable figures after 1999) / 7.2 degrees
This should be no surprise. These years are both from the decades (1930's and 1990's) that are generally held to be the warmest (at least in most of the Northern Hemisphere) after the general warming began in 1700 after the Little Ice Age and most probably its coldest part, the Maunder Minimum in 1640-1700. There are arguments that the 1990's were warmer than the 1930's but at least the Nordic countries show no difference. Furthermore there are indications that the current decade (from 2001 on) is not as warm as the other two decades. Some of the results that show that the 1990's to have been warmer seem to be a result of the heat island effect plus the bias caused by the addition of observation stations in larger cities that were not in the list in the 1930's.
Climate change in Northern Europe.
post one up then!How long did you have to look for those records, you silly old ass? Damn, virtually all the records kept by all the differant agencies in the differant nations state that the 1930's were nowhere as near as warm as the last decade.
I like how there is never any evidence to support the statement. All that dude had to do was post up one city. He most likely couldn't find one. Funny stuff though.How long did you have to look for those records, you silly old ass? Damn, virtually all the records kept by all the differant agencies in the differant nations state that the 1930's were nowhere as near as warm as the last decade.
2 seconds. And bullshit. The local records in almost all cases show the 1930's to have been significantly warmer. You're such a pathetic one trick pony. Try a different schtick...this one sucks.
that is very logical. Either the US counts or doesn't. What's not fair about that? Can't have it both ways as you seem to like to do. It's why he posted it. so extreme weather excess events, in the US don't count globally. You all say that all the damn time. Then we post something and get accused of Cherry picking. hahhahahahahha, dude that skipped right off your forehead you're so stupid.Mr. CrusaderFrank, perhaps you should promise to do posts that make sense. Then we never see you on this board again. And both your post and mine should be deleted. Neither has a thing to do with the subject and are just personal insults.
We have to remember that only the liberals on here get to make all the rules to play by. They state in almost every response, That link is from so and so, and that Rush guy said something so it isn't valid, all this play by my rules. So local weather to them is global and for us it's only local.I can play the local Gane too, July goes down as hottest month on record in Seattle | Weather Blog | Seattle News, Weather, Sports, Breaking News | KOMO Newsso where is it warmer? the Globe? Aren't the local areas part of the globe? Why can't you f00ls ever state things correctly? So again, where is it warmer?Why did you go local? We are talking global. I predicted that deniers would go local. Some other commenter said July wasn't the warmest month globally because the stadium he went to was chilly. LMAO!Right. But ALL local areas combined are the globe, not just your town or state. If Trump' wins the President, the fact that Hillary won the Bronx doesn't mean Trump didn't become President, you super idiot.July was the hottest month in Earth’s hottest year on record so far
Conservatives will now talk about cherrypicked local places within the United States where it wasn't so hot.
It's what they do. They go local.
Really? On which planet is that? According to the historical temperature record this July has been very mild. In my region we have had no days over 100 degree's which hasn't happened in decades. By far the hottest time on record is the 1930's.
You are spewing nothing but propaganda. Sad that you are too stupid to believe it...
I'll bet you say Australia.
Go ahead and tell me how many cities experienced their coldest July. I'll reply with my list of cities that had their hottest July, and it will make your list look puny.
EVERY single time there is a heat record broken you imbeciles trot it out as evidence of global warming. Whenever a sceptic does it...and we do it to mock you...you get all "well that's local and doesn't count!"
Pot...Meet kettle!
back to the climate causes forest fires are you now?Good for more burned forests, rangeland, and homes. Good for more dead firefighters. Good for a more unstable climate that increases the cost of food. Ain't that wonderful?
What happened to the 0.5 deg/decade that Hansen predicted to Congress in 1988.. He was only off by a factor of 5
The shameful denier lie just won't die.
But then, cults do need to create enemies to rally the faithful against, and Hansen is one of people they've chosen to demonize. Others that have reached such mythological status with deniers are Mann, Gore, Cook and Lewandowski.
Here's a longer piece on what the original Mann presentation said, pointing out how the error was 15%-25%, damn good for a 1988 model.
What do we learn from James Hansen's 1988 prediction?
Flac will now no doubt invoke Cook Derangement Syndrome. That's how cults work. To a cultist, any cult proclamation can't be debunked, because any debunking is simply auto-defined as part of the conspiracy against the cult.
After reading Spencer’s announcement, I can only reflect on the fact that the challenges in producing a temperature record are at least equal, if not more difficult, with satellite data as compared to surface station data. From his announcement I read that:No it didn't, you just make that shit up. UAH does not use the satellite RSS uses that is drifting.
RSS is still using the old NOAA-15 satellite which has a decaying orbit, to which they are then applying a diurnal cycle drift correction based upon a climate model, which does not quite match reality. We have not used NOAA-15 for trend information in years…we use the NASA Aqua AMSU, since that satellite carries extra fuel to maintain a precise orbit.
- Roy Spencer, 2011
Drift correction on the MSU version sats is a couple HUNDRETHS of a degree in temperature. Even less for the AMSU versions.. You're really stretching for a story here..
1. There is data from sixteen satellites.
2. There is instrument calibration and satellite orbital drift.
3. The various satellites have different calibrations.
4. There are frequency differences between satellites.
5. Differences in time of observation.
Concerning all this Spencer states: All data adjustments required to correct for these changes involve decisions regarding methodology, and different methodologies will lead to somewhat different results.
Spencer comes right out and admits you can make the satellite data say anything you want depending on the methodology you choose. Whatever flaws there might be in land station coverage, it is always the same coverage and therefore the TRENDS for the areas covered are valid even if the overall global temperature can't be accurately calculated.After reading Spencer’s announcement, I can only reflect on the fact that the challenges in producing a temperature record are at least equal, if not more difficult, with satellite data as compared to surface station data. From his announcement I read that:No it didn't, you just make that shit up. UAH does not use the satellite RSS uses that is drifting.
RSS is still using the old NOAA-15 satellite which has a decaying orbit, to which they are then applying a diurnal cycle drift correction based upon a climate model, which does not quite match reality. We have not used NOAA-15 for trend information in years…we use the NASA Aqua AMSU, since that satellite carries extra fuel to maintain a precise orbit.
- Roy Spencer, 2011
Drift correction on the MSU version sats is a couple HUNDRETHS of a degree in temperature. Even less for the AMSU versions.. You're really stretching for a story here..
1. There is data from sixteen satellites.
2. There is instrument calibration and satellite orbital drift.
3. The various satellites have different calibrations.
4. There are frequency differences between satellites.
5. Differences in time of observation.
Concerning all this Spencer states: All data adjustments required to correct for these changes involve decisions regarding methodology, and different methodologies will lead to somewhat different results.
You haven't quite thought thru 100,000 thermometer alternative with 100s of miles of gaps, altitude differences, manual vs auto reading, etc between them have you?
Time of observation variances for the sats are slowly changing as to amount to microseconds/day. What is the variance in the manual reading stations in Africa?
How much of the land readings are REAL as opposed to "invented" by filling in empty space.
If that empty space covers 3000 ft in elevation --- what do you use for a lapse rate?
Ya got some more thinking to do there son...