Noaa says 2013 is holding onto 6th warmest/Sept tied for 4th warmest!

Liberal chicken littles can't even enjoy a mild September without predicting doom and gloom. What a bunch of pathetic a-holes.

That's not what your mother said. ;-)

ps: she suggested I encourage you to finish high school.... or at least get admitted.
 
Last edited:
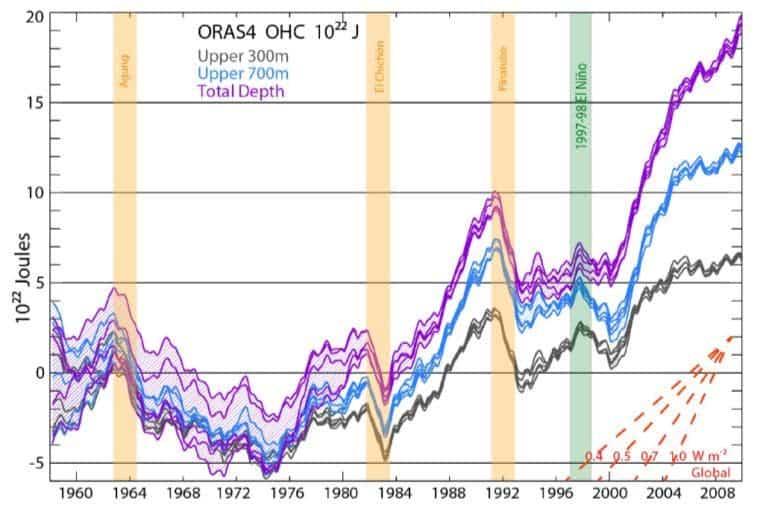
Btw. I could not find this picture in any of the Geophysical Research letters.
It`s been fabricated and based on nothing more than estimates:
climate-change-oceans.jpg


Note the grey line which supposedly represents the surface temperature as an average of all oceans...and does not even jive with any current satellite data.

That grey line was not sensational enough so they display the theoretical integral of the total heat content for the total mass of water all the way down to the "total depth", (what they used for that value nobody knows) ....
In addition to that they decided to terminate the grey line which already levels off at 2004 at 2008, clipping off 2008 to presents.
So how "recent" can this "study" be if it has no data from 2008 to the present.
It`s not as if that data were not available.
It does not fit their curve into doom, not even the grey line from 2002 to 2008.
But you are supposed to have your eyes glued to the purple line which is a total fabrication and keeps climbing exponentially just like any other integral function..

So, when you don't know, you just make shit up?
 
Last edited:
Last edited:
How do you manage to throw all these numbers around and still make such basic mistakes?

That isn't radiation shining on the ocean. That's heat already there. That's Ocean Heat Content. Do you understand "Content"?

I did suspect that you are not exactly brilliant, but now I`m finding out just how dumb you are.

All along we are discussing if man and the 1.6 watts/m^2 attributed to CO2 "back radiation" has anything to do with the ocean`s current heat content.
  • Some recent studies have concluded based on the slowed global surface warming over the past decade that the sensitivity of the climate to the increased greenhouse effect is somewhat lower than the IPCC best estimate. Those studies are fundamentally flawed because they do not account for the warming of the deep oceans.

  • The slowed surface air warming over the past decade has lulled many people into a false and unwarranted sense of security.
And you turn around and reply:
That isn't radiation shining on the ocean. That's heat already there. That's Ocean Heat Content. Do you understand "Content"?
I wish somebody from the IPCC would say "That isn't radiation shining on the ocean. That's heat already there." ...that would have been an astonishing admission how full of crap they had been all along and that the heat content of the oceans has not been elevated in any way that could be attributed to ppm atmospheric CO2 .

Unfortunately that statement came from a singularly dimwitted moron.
All we can do with that is bookmark it and stick it in your face every time you shoot off your mouth again.
 
Last edited:
So in essence when the claim is made is made that 90% of the additional forcing (1.6W/m2) is "going into the oceans" ---- Abraham doesn't know and doesn't care HOW it ended up at >700m or HOW MUCH contributed to surface warming.

That was the point of my little calculation.. Fairly simple to calculate about 20 * 10e22 joules failling on the oceans for the past 15 years. Over those 15 years, about 15 * 10e22 joules is measured in that BTK "memo" (its not really a study and maybe they'll NEVER be a real paper).

Now the REST of that energy (the other 5 * 10e22 joules) COULD be lost not thru RADIATION, but thru conduction and convection. So the number I calculated APPEARS to be right and BTK agrees with that number doesn't it?

But what I wanted to point out is how ACCURATELY that "hidden" heat is all accounted for. Isn't it a little too inconvienient? Like maybe BTK did the same calculation to find out how heat they needed to account for?

Now there's a little physics problem here.. Has to do with taking taking all that "heat" OUT of the SURFACE radiation and burying it in Davey Jones locker.. What would happen to the SURFACE temperature (the only place where CO2 backrad can effect) if you REMOVED about half of those "excess Joules" from the radiative exchange?
 
Last edited:
Based on the total stupidity exhibited above I am left with the conclusion that abe is pmsmz.
No two people could be that fundamentally stupid in the same thread.
 
So in essence when the claim is made is made that 90% of the additional forcing (1.6W/m2) is "going into the oceans" ---- Abraham doesn't know and doesn't care HOW it ended up at >700m or HOW MUCH contributed to surface warming.

That was the point of my little calculation.. Fairly simple to calculate about 20 * 10e22 joules failling on the oceans for the past 15 years. Over those 15 years, about 15 * 10e22 joules is measured in that BTK "memo" (its not really a study and maybe they'll NEVER be a real paper).

Now the REST of that energy (the other 5 * 10e22 joules) COULD be lost not thru RADIATION, but thru conduction and convection. So the number I calculated APPEARS to be right and BTK agrees with that number doesn't it?

But what I wanted to point out is how ACCURATELY that "hidden" heat is all accounted for. Isn't it a little too inconvienient? Like maybe BTK did the same calculation to find out how heat they needed to account for?

Now there's a little physics problem here.. Has to do with taking taking all that "heat" OUT of the SURFACE radiation and burying it in Davey Jones locker.. What would happen to the SURFACE temperature (the only place where CO2 backrad can effect) if you REMOVED about half of those "excess Joules" from the radiative exchange?

And who knows what temperatures they assigned to which depth and which ocean to arrive at a total "ocean heat content".
No matter how they want to slice and dice it with just 1.6 watts per m^2 it would take 2900 hours to heat a perfectly insulated 25 m^2 & 1 meter deep pool with a fully submerged 25 watt heater by 1 single degree C using the equivalent of 1.6 watts/m^2 CO2 back radiation energy flux.

Again that assumes that the heater was fully submerged and implies there was zero heat loss.
I`m pretty sure there is as much CO2 inside my house as is outside.
If I fill up a ~ 2 by 1 by 0.5 meter bathtub with hot water and and stick the equivalent heater to get a 1.6 W/m^2 energy transfer into it and get into that tub 2900 hours later then I`m pretty sure I would be taking a cold bath.
Now go figure how they arrived at their total extra heat content in all of our oceans that could be attributed to CO2 after several decades.

It sure as hell was not based on measurements and sure as hell did not include increasing water surface to air heat exchange/ per delta T over warmer water which affects the weather.

They consider that aspect only when a storm makes landfall but manage to tank up an "unusual number of storms" with a shitload of "extra energy" from the oceans , but their theory does so without any ocean heat content loss.
The average hurricane rages at over 500 trillion watts and can last for weeks...all the while sucking it up from the water below.
And that`s the only time most us us take notice just how much heat is transferred by evaporation & convection ...it goes on all the time even when there are no major storms...round the globe 24/7
If would not take much of a drop in solar activity to turn our world into a deep-freezer yet again and adding more CO2 would not slow that process down any more than a bare-foot Fred Flintstone break could stop a a freight train on a downhill run.
Why am I discussing this with you?
It`s not that I think you don`t know any of this but it makes no sense to address it to the alarmists who rejoice with every drought or severe weather event, especially when there are casualties.

It`s not just the dire finances they blame on conservatives, they had no problem to use "Sandy" for their political agenda either and will continue to do so even if Washington were buried under 6 feet of snow & ice year round !


.
 
Last edited:
Dont have any opinions on this yet. Thinking out loud. And im sure u r correct about the dissapointing warming of water with a 1.6w heater. What smells to me here is that according to btk, about half of that heat went to the very deeps.(ive seen noaa guys objecting to that) And Btk only gives reults for the 1st 300 meters of depth, not the surface warming. But what seems clear is that with their FOUND HEAT, and the simple calculation that I did, theres simply not enough joules left from the 1.6w to ever effect an increase of surface temp on the oceans.

By extensionn of theses numbers,, before the 1.6w imbalance exisred, this same amount of storage flow should have frozen up the oceans centuries ago.

Thats what im slowly pondering here. Need to calculate the number of joules required to give the observed surfae temp risse in the (say) 1st 10 meter volume. But ive had a beer tonight. And even one can make me stupid.

All that is assuming the world and the ocean temps were in perfect balance before evil capitalists started to exploit fossil fuel.
 
Strange that you should be leaning so hard on that one graph and study.. And calling us "fooking idiots" when you couldn't figure out the significance of this little calculation that I did a couple weeks back.. I posted it TWICE --- right after you referenced the BTK study for the umpteenth time.. Got no response or even RECOGNITION of what that calculation implied..
Code:

Mamooth said I didn't explain it.. That was ON PURPOSE. I expect that folks REPOSTING that BTK study would automatically know the challenge I was making.. I'd like to believe that I'm not dealing with "fooking idiots"...

I`m only concerned about this part:
1.6W/m2 * (361*10e12)m2 * (3.15e7)sec/yr * 15yr * 0.90 = 24.6e22 joules
Joules is the same as watt seconds anyway, but neither will tell you by how much it will raise the temperature unless it has been specified what the mass (or volume) of water was that absorbed the 1.6 W/m^2.
1 watt second = 0.239 calories...= the heat energy required to raise 1 gram of water by 1 degree. So you need to know the mass, not just the area and the # of watts & the time.
With 1.6 watts per square meter we get about as much heating as a 25 watt pencil soldering iron dipped into a 5 X 5 meter swimming pool.
Inflatable-Swimming-Pool.jpg
pRS1C-2160650w345.jpg


There is no way to calculate with any degree of accuracy how long it would take to raise the pool temperature by 1 degree C not even if I would give you the depth which would then also give you the mass of water.
Unless the heat source is near the bottom, not at the top and the pool is covered and 100% insulated you would be way off.

But in reality on the ocean the 1.6 watts/m^2 is above the surface, 15 µm IR does not deep penetrate liquid water and the slightest breeze of air will cause more heat loss per time & m^2 than the 1.6 watts can supply.

To say that the "missing heat" can be found in the deep part is utter nonsense. You could hold a blow torch all day long to the top of a bucket full of water and never manage to bring it to a boil.
If you don`t have a blowtorch just go & disconnect the lower element of your hot water tank and try heat it just with the top element.
The only part that warms up is from where that element is & the top.
Open the drain valve at the bottom and all you get is cold water.
There are only a few places along the coasts where you get some "up-welling" and bottom/top heat transfer in our oceans where the extra 1.6 W/m^2 could get transferred down.
That is certainly not the case for the entire ocean area and for 24/7 year-round. And in addition to that the bulk of the surface water heat is dissipated into the air above it by evaporation & convection...not down into the depth.
So in the final analysis it`s rather silly to "calculate" by how much 1.6 watts/m^2 surface heat can warm up an entire ocean over a decade, while a few gusts of wind can drain more surface water heat in a matter of minutes than what had been absorbed with a mere 1.6 watts/m^2 all day long.
With hurricanes it`s called "rapid intensification" for a good reason...it`s a rapid heat exchange on a much larger magnitude than just a few watts/m^2 !

Excellent . Would love to discuss this with anyone that understands where this energy might have went. That big number is the 90% claimed to be absorbed by the oceanss. Cant do it right now but there are many implications. Maybe start a thread.

If you've read BTK, you know how the data in that graph was produced.
 
Dont have any opinions on this yet. Thinking out loud. And im sure u r correct about the dissapointing warming of water with a 1.6w heater. What smells to me here is that according to btk, about half of that heat went to the very deeps.(ive seen noaa guys objecting to that) And Btk only gives reults for the 1st 300 meters of depth, not the surface warming. But what seems clear is that with their FOUND HEAT, and the simple calculation that I did, theres simply not enough joules left from the 1.6w to ever effect an increase of surface temp on the oceans.

By extensionn of theses numbers,, before the 1.6w imbalance exisred, this same amount of storage flow should have frozen up the oceans centuries ago.

Thats what im slowly pondering here. Need to calculate the number of joules required to give the observed surfae temp risse in the (say) 1st 10 meter volume. But ive had a beer tonight. And even one can make me stupid.

All that is assuming the world and the ocean temps were in perfect balance before evil capitalists started to exploit fossil fuel.

There is no way to do that and come up with a result that is even remotely accurate. The variations are way too large, not just the temperature but also for the area for each respective temperature.
That applies also for the time frame duration till you get an entirely different temperature magnitude & area profile a short time later.
Take any time frame and average temperature and/or heat content for it, you will never come up with the same overall value even if you do it for the next time frame in the same area when the same satellite updates...most of them do it in 15 minute intervals.

And as far as temperature versus depth is concerned:
Thermocline - Wikipedia, the free encyclopedia
Most of the heat energy of sunlight is absorbed in the first few centimeters at the ocean's surface, which heats during the day and cools at night as heat energy is lost to space by radiation. Waves mix the water near the surface layer and distribute heat to deeper water such that the temperature may be relatively uniform in the upper 100 m (300 ft), depending on wave strength and the existence of surface turbulence caused by currents. Below this mixed layer, the temperature remains relatively stable over day/night cycles. The temperature of the deep ocean drops gradually with depth. As saline water does not freeze until it reaches −2.3 °C (colder as depth and pressure increase) the temperature well below the surface is usually not far from zero degrees.
I doubt that ocean heat content or temperature has changed deeper down and done so with the extra 1.6 watts/m^2 CO2 back-radiation absorbed in a cm thin layer at the surface.
"Heat content" will always go up if you enter more water volume into the equation.
500 liters of 1 deg C water have a 20 times higher heat content than 1 liter of water at say +25 C and that ( the additional 499 liters of cold water) did in no way increase the temperature.
But according to the resident main-idiot it does, because he believes that heat content = temperature, regardless of the mass.
The graph is OCEAN HEAT CONTENT vs TIME. It is NOT a graph of insolation. It is, effectively, temperature.
 
Last edited:
Exactly. The claim that the "missing heat" is stored in the depths is patently absurd. It defies every law of physics known.
 
Exactly. The claim that the "missing heat" is stored in the depths is patently absurd. It defies every law of physics known.
And that`s being kind. Patently absurd was not the first thing that came to my mind when I saw that:
The graph is OCEAN HEAT CONTENT vs TIME. It is NOT a graph of insolation. It is, effectively, temperature.
I had the same run-in with IanC last year but IanC dumped that concept quickly and it turned out that it was not stupidity on his part.
He was just a bit sloppy with his terms and definitions when discussing heat and temperature. In physics you don`t have to spell out the whole thing as "heat content". It is understood if you just say "heat" that it is not temperature as it were in colloquial English.
But now we are not dealing with IanC and language ambiguities.
This Abraham & PMZ crap is at a level of stupidity you could expect from a lab-rat with deliberately induced fetal alcohol syndrome.
What`s really funny, is the "PMZ signature line":
The idea that people who don't know enough also don't know enough to realise that they don't know enough ("Dunning-Kruger effect" is so much simpler to get your tongue around) isn't particularly new. Bertrand Russell in The Triumph of Stupidity in the mid 1930s said that "The fundamental cause of the trouble is that in the modern world the stupid are cocksure while the intelligent are full of doubt." Even earlier, Charles Darwin, in The Descent of Man in 1871, stated "ignorance more frequently begets confidence than does knowledge."
And how often Abraham the 3.rd congratulates his own "intelligence" he attributes to the fact that he is and will remain a liberal no matter what because he figures that`s some sort of badge for so called "intellectuals".

All the while that sort of intransigence is a hallmark psychologists use to evaluate singularly narrow minded people.

I have been supporting some liberal ideologies on occasion and was just as jubilant as any person in the crowd when Obama was sworn in the first time. Much like most people round the globe were.
Aside from the "forever liberal" idiots, no matter what in the U.S. there has been an about turn world wide and none of these people in the rest of the world watch Fox news or listen to Limbaugh to do the "thinking" for them.

For that matter they don`t just apply this to Obama they also do it with the ever more ridiculous IPCC Ar`s and these incessant doomsday prophecy threats,
that "Abraham3" the 3.rd...our resident doomsday prophet posts all day long, every day since he registered here.
So what happened to "numan" and "Saigon"...do you know ?
They got a nice collection of red dots and then vanished.
That monster font-Thunder Idiot and poopidoo "physicist" they`ve been pretty quiet for quite some time too..
We better quit peppering what`s left of our resident retards with red re-dots else the last source of daily amusement is gone.
To prevent that I actually gave our siamese cat some + rep-points....when "mamooth" figured I never heard of Firefox and the plugins.
I clicked on the + rep & the thankyou button even though I never used anything but Firefox and the very same plugins.
Then again he is not a retard just occasionally obnoxious and stretching the truth a bit too far...which is excusable seeing he`s a loyal liberal.
Funniest of all is how most of them try to get under our skin but can`t take it when Skook replies in kind.


.
 
Last edited:
Dont have any opinions on this yet. Thinking out loud. And im sure u r correct about the dissapointing warming of water with a 1.6w heater. What smells to me here is that according to btk, about half of that heat went to the very deeps.(ive seen noaa guys objecting to that) And Btk only gives reults for the 1st 300 meters of depth, not the surface warming. But what seems clear is that with their FOUND HEAT, and the simple calculation that I did, theres simply not enough joules left from the 1.6w to ever effect an increase of surface temp on the oceans.

By extensionn of theses numbers,, before the 1.6w imbalance exisred, this same amount of storage flow should have frozen up the oceans centuries ago.

Thats what im slowly pondering here. Need to calculate the number of joules required to give the observed surfae temp risse in the (say) 1st 10 meter volume. But ive had a beer tonight. And even one can make me stupid.

All that is assuming the world and the ocean temps were in perfect balance before evil capitalists started to exploit fossil fuel.


You are taking the wrong approach to this problem.
One beer would not be enough to get me to try and "average" that dog`s breakfast.
This is how you do it:
[ame="http://www.youtube.com/watch?v=lxNZZ7BA2H0"]Tuborg Beer Commercial - YouTube[/ame]

It works not just if you want to see "above average" temperature, it works for everything else.
Mind you "Tuborg" or any other European beer is a bit stronger and it might take a whole case of Buds before you can see things they way PMZ and Abe the 3.rd see it...Anyway that`s what it takes to "recognize" a beautiful relationship such as with CO2 and deg T or "above average" women after some more beer.
Unfortunately when you sober up later you`ll be disappointed again.
Of course those who never sober up don`t have that problem.
Maybe the stuff that Abe the 3.rd and PMZ smoke has a more durable effect.
 
So what happened to "numan" and "Saigon"...do you know ?

If you've won 56-0, it's kind of classless to do a victory dance.

I`m not doing a "victory dance" and also don`t subscribe to any sort of classes ever since I finished school. As far a "class" in context with social standing is concerned I don`t hold much stock with that either.
I`ve had the privilege to meet some folks who dressed in rags but have more "class" in that sense, than many of those who dress in suits that cost more than what I paid for all of the cars I ever had.
That`s the scum I really detest...namely those who pretend to have "class" and try flaunt that....and all the above mentioned fit that bill perfectly. Mind you I`ve met and befriended some folks who are extremely well heeled and truly have "class" as well, but then again these people don`t brag or flaunt it. One of them...it took me by total surprise when I walked into the estate address when he invited me.
I only knew him as a member of the Montreal chess club and only seen him in blue jeans and T-shirts. So I thought he was employed as either chauffeur, gardener or something on "Nun`s Island"...turned out he owns it. I`ve met a lot of other similar people in the Yukon and one couple was camped for a whole month in my yard and ate at my table till I found out from another German Tourist that he was the CEO of Deutsche Bank.
In short I probably don`t define "class" they way you think I define it...but now you know what I use as a measure !
 
Last edited:
So what happened to "numan" and "Saigon"...do you know ?

If you've won 56-0, it's kind of classless to do a victory dance.
Btw. Last year you mentioned that you bought one of these hub motors for your bicycle. You should see the insane prices they charge for these in Canada + tax & import customs duty.
How much did your`s set you back?
The reason why I`m asking you and not any of my friends in Europe because there is way too much red tape to get one shipped from there.
Last month we made the decision to give our house in the country to our son Robert and moved to Winnipeg. I still have my van but I can go and get almost everything we need close by on foot faster than by car.
Nobody in their right mind would consider using a bike other than during the short summers we have in Manitoba.
But in the summer a bike like could be a lot of fun. I built an electric tricycle for my 4 year old great grand son Amadeus but living where we chose to live now cutting, welding, grinding etc is no longer do-able.
I donated my entire shop & all my tools, welders, generators etc to a boy`s camp and could do it there...but that camp is all the way in Northern Saskatchewan...in short I`m looking for something cheap and "off the rack" ...because they do steal a lot of bicycles in Winnipeg.
Anyway as you can easily see my "carbon footprint" is not anywhere near as what you suspected it might be either.
Also on a provincial level (=state equivalent) my entire family (your`s truly included) votes most of the time liberal, but in federal elections it`s been conservative no more than ~ 50 % of the time over the last 40 years.
So what does that make me in your opinion?
You can do a "victory dance" if you want to...it`s Okay by me.
I`ld still make a reasonable offer for your bike!...maybe more than you think...and you could do a victory dance after that !

I`m just glad that Canada is and never has been as polarized as what`s going on south of our border and most of us here can`t understand how so many of people south of our border allowed the media to whip up so much resentment against others that have a different view....and from our (Canadian) vantage point it`s mostly American Liberals that perpetuate that situation....a view that is also shared by almost every E.U. member state since Obama`s second term.
 
Last edited:
Dont have any opinions on this yet. Thinking out loud. And im sure u r correct about the dissapointing warming of water with a 1.6w heater. What smells to me here is that according to btk, about half of that heat went to the very deeps.(ive seen noaa guys objecting to that) And Btk only gives reults for the 1st 300 meters of depth, not the surface warming. But what seems clear is that with their FOUND HEAT, and the simple calculation that I did, theres simply not enough joules left from the 1.6w to ever effect an increase of surface temp on the oceans.

By extension of theses numbers,, before the 1.6w imbalance exisred, this same amount of storage flow should have frozen up the oceans centuries ago.

Thats what im slowly pondering here. Need to calculate the number of joules required to give the observed surfae temp risse in the (say) 1st 10 meter volume. But ive had a beer tonight. And even one can make me stupid.

All that is assuming the world and the ocean temps were in perfect balance before evil capitalists started to exploit fossil fuel.


You are taking the wrong approach to this problem.
One beer would not be enough to get me to try and "average" that dog`s breakfast.
This is how you do it:
[ame="http://www.youtube.com/watch?v=lxNZZ7BA2H0"]Tuborg Beer Commercial - YouTube[/ame]

It works not just if you want to see "above average" temperature, it works for everything else.
Mind you "Tuborg" or any other European beer is a bit stronger and it might take a whole case of Buds before you can see things they way PMZ and Abe the 3.rd see it...Anyway that`s what it takes to "recognize" a beautiful relationship such as with CO2 and deg T or "above average" women after some more beer.
Unfortunately when you sober up later you`ll be disappointed again.
Of course those who never sober up don`t have that problem.
Maybe the stuff that Abe the 3.rd and PMZ smoke has a more durable effect.

Hey !!!! EVen when I've TRIED 2 or 3 Pilsner Urquell (what my German buds at Siemens prefer) --- I STILL can't stop seeing how ugly the practice of AVERAGING EVERYTHING is to understanding ANYTHING about climate.

Climate doesn't run on "averages". PERIOD.. You could probably make a statement that 90% of the ocean heat is contained in just 40% of the geographical area.
They've also "averaged" the primary driving energy from the sun. By normalizing solar insolation to the total area of the earth.. Not realizing how silly all that is to a climate system or the ACTUAL distribution and PEAK insolation numbers at the equators that matter.

But STILL -- I need to show that BTK found TOO MUCH heat "hiding in the deeps". And even if the test is to assume only the top METER of the surface --- I think that can be done.
What also escapes me is the appearance that climate STORAGE MECHANISMS never occurred to TrenBerth before. EVEN AFTER he got fame for his misnamed "Energy diagram". The lack of storage in their climate models was ONE of my objections all along.

So NOW, because their crappy models without storage failed --- "they" have discovered storage. AND MEASURED IT. The ASSUMPTION that this storage battery was BALANCED before industrial times is kinda weak. Because you can only get spikes in that battery if you are CHARGING it. Say with a 1.6W/m2 source. I doubt that "balance" is anything more than that "average" girl in your commercial turning beautiful.. ((As you said --- ANY imbalance would integrate over time and become apparent))

On the list of stuff to do..

1) calculate the joules required to raise the top meter to a 0.6degC anomaly.
2) search for any indication that the BTK assertion will EVER APPEAR in a real MULTI-PAGE paper (rather than a 2 page "letter")
3) Buy another 6 pack of Pilsner Urquell to get me thru the month..


BTW: If you REALLY WANT brain freeze, the 1.6w/m2 is NOT constant over the surface either. It's been calculated that the diff between equator and poles is quite large. Because of atmos thermal profiles and heat of compression. In fact, at the poles, the SURFACE power of CO2 is higher than it is at any other lattitudes. While at the equator, the effect maxes out higher in the troposphere. TO MY KNOWLEDGE -- I've never seen a map of the ACTUAL forcing function as it is TRUELY distributed over the globe. Maybe item #4 in my list above.
 
Last edited:
BTW: If you REALLY WANT brain freeze, the 1.6w/m2 is NOT constant over the surface either. It's been calculated that the diff between equator and poles is quite large. Because of atmos thermal profiles and heat of compression. In fact, at the poles, the SURFACE power of CO2 is higher than it is at any other lattitudes. While at the equator, the effect maxes out higher in the troposphere. TO MY KNOWLEDGE -- I've never seen a map of the ACTUAL forcing function as it is TRUELY distributed over the globe. Maybe item #4 in my list above.

For now I`ll address only the last part of your post else these important points you just mentioned get too buried.
The IPCC sidesteps the pressure and thermal profiles right at the start when they input ppm CO2 and report it as a molar fraction in dry air with (water vapor excluded) and at standard pressure . That automatically has the same effect as if you had used an average value for barometric pressure and all the other variables for the whole globe and for any altitude. It`s not milligrams C02 per liter of air as in ppm (weight per volume) which is the standard used in analytical chemistry.
The existing computer models would go tilt if you would have to feed it actual ppm CO2 as obtained along with all the other atmospheric conditions which existed at the time of sampling and where you sampled....and then a model would have to work out what the actual ppm (weight per volume) was for all other locations at different altitude, barometric pressure, moisture and then "average" all these.
So they use the same molar fraction for the entire globe from the surface up to higher elevations....and with that they extrapolate the rest.
But that`s not how light of any wavelength is absorbed in the real world.
If I let you have 1 liter of warm & moist air at a lower pressure and another one at a higher pressure or denser air in 2 sealed sampling vessels each containing 400 ppm CO2 as in weight per volume they would not yield the same % absorption value on an IR spectrophotometer...unless you maintain the exact same barometric conditions and air density that existed in each individual sample vessel. Else the gas in the denser one would expand the moment you draw your air sample from it and pipe it into a IR cuvette which does not match that pressure and the other one would be compressed if your IR spectrophotometer cuvette is at a higher barometric pressure. Resulting on a lower absorption in the first case and a higher one in the latter.

Point being 400 ppm CO2 molar ratio at the colder & denser air in the polar regions and 400 ppm molar CO2 in the tropics don`t have the same % absorption as you suspected already.


The IPCC prefers to cloak this discrepancy by phrasing it like this:
Why do we express the abundance of CO2 as a mole fraction in dry air? The concentration of a gas is defined formally as the number of molecules per cubic meter. The goal of our measurements is to quantify how much CO2 has been added to, or removed from, the atmosphere. The concentration does not give us that information because it primarily depends on the pressure and temperature, and secondarily on how much the relative abundance of each gas has been diluted by water vapor, which is extremely variable.
Pretty slick eeh?
Too bad they don`t show any of their actual instrument output, but I have seen it because the "Astro Lab" on Ellesmere used the exact same setup as they do on Mauna Loa today...and I`ve been in the Astro Lab and calibrated their set-up for their "technicians" which were mostly volunteer exchange students from Europe with next to zero tech-background.
It works like this:
How does the CO2 analyzer work? Air is slowly pumped through a small cylindrical cell with flat windows on both ends. Infrared light is transmitted through one window, through the cell, through the second window, and is measured by a detector that is sensitive to infrared radiation. In the atmosphere carbon dioxide absorbs infrared radiation, contributing to warming of the earth surface. Also in the cell CO2 absorbs infrared light. More CO2 in the cell causes more absorption, leaving less light to hit the detector. We turn the detector signal, which is registered in volts, into a measure of the amount of CO2 in the cell through extensive and automated (always ongoing) calibration procedures.
The ones I have worked on use a peristaltic pump and you can see the increased % absorption peak due to sample compression each time a roller squeezed the plastic tube through which the sample is pumped into the measuring cuvette.
Of course it`s legit to ignore these peaks and average them, just don`t go so far and claim that % actual IR absorption is pressure and density independent round the globe..as it will be if all these variable are washed out right at the start with the molar ratio at no moisture and reduced to 1 single standard barometric pressure & density which is then applied globally.
What follows after in their projections and the temperature correlations + back-radiation estimates is for me already irrelevant from that point on, because of all that ironing out of the primary data.
Of course these errors don`t show up the way most errors do, because they still apply the same errors at the same magnitude ever since they started. This error constant became visible only after the coincidental correlation between ppm CO2 and delta T had been stalled for 15 years and not even closely resembles what had been calculated for 400 ppm CO2....and sure as hell not on a global scale.
More % IR ("heat") energy is not the same as more heat in the form of a higher temperature..."heat content" and temperature is not the same, no matter if the medium is water or a gas. The only way the temperature can go up in a gas by the theoretical value the heat energy represents is if all other heat energy consuming avenues, in this case expansion or pressure changes and especially water evaporation are prevented.I really don`t care how many IPCC "scientists" agree with each other. As far as I`m concerned there are limits to what we should be expected to consent to.

Sometimes consent helps create the funniest scenarios..Then again, according to mamooth, I have no "class" and that`s why I can kill myself laughing watching that video. I wonder what kind of beer was involved here.
 
Last edited by a moderator:
From AR5, WG-I, The Physical Science Basis

2.2.1 Well-Mixed Greenhouse Gases

AR4 (Forster et al., 2007; IPCC, 2007) concluded that increasing atmospheric burdens of well-mixed
greenhouse gases (GHG) resulted in a 9% increase in their radiative forcing from 1998 to 2005. Since 2005,
the atmospheric abundances of many well-mixed GHG increased further, but the burdens of some ozone depleting substances (ODS) whose production and use were controlled by the Montreal Protocol on Substances that Deplete the Ozone Layer (1987; hereinafter, ‘Montreal Protocol’) decreased.

Based on updated in situ observations, this assessment concludes that these trends resulted in a 7.5% increase in radiative forcing from greenhouse gases from 2005 to 2011, with CO2 contributing 80%. Of note is an increase in the average growth rate of atmospheric CH4 from ~0.5 ppb yr–1 during 1999–2006 to ~6 ppb yr–1 from 2007 through 2011. Current observation networks are sufficient to quantify global annual mean burdens used to calculate radiative forcing and to constrain global emission rates (with knowledge of loss rates), but they are not sufficient for accurately estimating regional scale emissions and how they are changing with time.

The globally, annually averaged well-mixed GHG mole fractions reported here are used in Chapter 8 to calculate radiative forcing. A direct, inseparable connection exists between observed changes in atmospheric composition and well-mixed GHG emissions and losses (discussed in Chapter 6 for CO2, CH4, and N2O). A global GHG budget consists of the total atmospheric burden, total global rate of production or emission (i.e., sources), and the total global rate of destruction or removal (i.e., sinks). Precise, accurate systematic observations from independent globally distributed measurement networks are used to estimate global annual mean well-mixed GHG mole fractions at Earth’s surface, and these allow estimates of global burdens. Emissions are predominantly from surface sources, which are described in Chapter 6 for CO2, CH4, and N2O. Direct use of observations of well-mixed GHG to model their regional budgets can also play an important role in verifying inventory estimates of emissions (Nisbet and Weiss, 2010).

Systematic measurements of well-mixed GHG in ambient air began at various times during the last six decades, with earlier atmospheric histories being reconstructed from measurements of air stored in air archives and trapped in polar ice cores or in firn. In contrast to the physical meteorological parameters discussed elsewhere in this chapter, measurements of well-mixed GHG are reported relative to standards developed from fundamental SI base units (SI = International System of Units) as dry-air mole fractions, a unit that is conserved with changes in temperature and pressure (Box 2.1). This eliminates dilution by H2O vapour, which can reach 4% of total atmospheric composition. Here, the following abbreviations are used: ppm = µmol mol–1; ppb = nmol mol–1; and ppt = pmol mol–1. Unless noted otherwise, an average of NOAA and AGAGE annually averaged surface global mean mole fractions are described in Section 2.2.1 (see Supplementary Material 2.SM.2 for further species not listed here).
 

Forum List

Back
Top