More Magic Marker Mania from Hansen over at GISS

IanC

Gold Member
Sep 22, 2009
11,061
1,344
245
times have been rough over at the CAGW compound. mother nature just hasnt been co-operating like she did back in the good ol' days. the public has been hearing more and more conflicting results and disturbing reports of scientific impropriety in climate research.

what can CAGW luminary James Hansen do to bolster the rather limp data coming in? he has a brilliant idea! Muller's BEST project derived even higher temps than the other groups producing global temp data sets, and BEST was seen to be leaning towards the skeptical side. how did they do it? to make a long story short, the BEST algorithms chop up data histories and discard suspicious inputs. because there is a positive trend cooler data are much more likely to get discarded than warmer ones and the average goes up. just what Hansen needs!

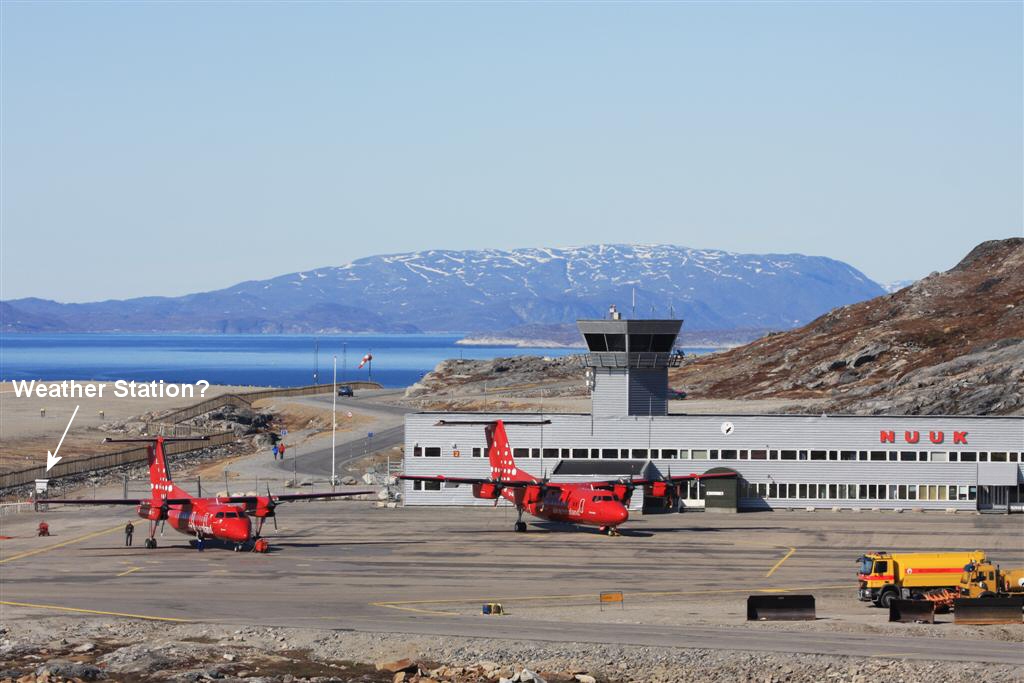
Greenland data are sparse, noisy and often incomplete. perfect to try out this new idea. but I guess it was too much work so he just took out the (suspicious) data from the early 80's and then subtracted 1C from all the pre-1980 numbers. voila! the Nuuk temperature chart looks much better now.

NuukCorruption.gif


here is a look at the 'adjustments'.

ScreenHunter_09-Jan.-15-16.43.jpg


funny how so many years need exactly 1C fixing, isnt it?

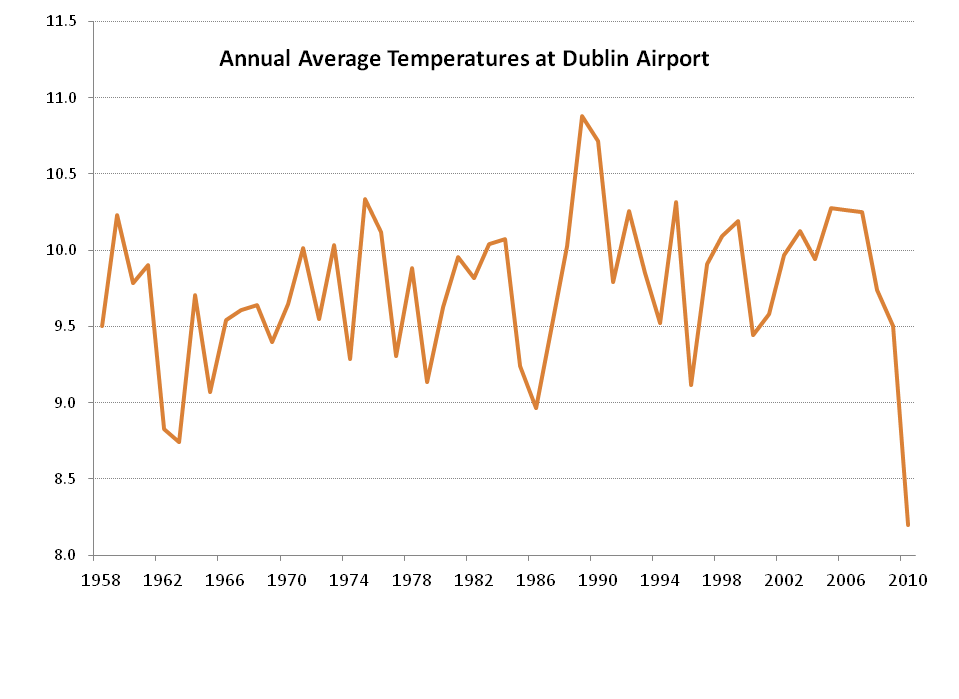
here is a graph from 2008 for those who think the comparator 'before' numbers might be wrong.

128_1.gif


and the link to read the interesting article on how the AMO seems to affect arctic temps. Google Image Result for http://images.intellicast.com/App_Images/Article/128_1.gif
 
its funny how the early 80's data was suspicious but the late 00's, where it goes up 3.5C one year and right back down 3.5C the next is just fine.
 
ScreenHunter_27-Jan.-16-07.59.jpg


ScreenHunter_28-Jan.-16-08.05.jpg


this points out one of the main failings of making correction over correction over adjustment to all the temperature readings from the last 150 years. DO THEY MAKE SENSE IN THE REAL WORLD?????
 
its funny how the early 80's data was suspicious but the late 00's, where it goes up 3.5C one year and right back down 3.5C the next is just fine.

I really cant understand why no one else but me finds this interesting and informative. oh well.

google earth picture of the weather station in NUUK. propwash anyone?

panaramio_nuuk_35649909.jpg


read the article to find out just how lazy and inept GISS is at collating and QCing temp data. Watts Up With Nuuk? | Watts Up With That?
 
another one

Dublin1.gif


I downloaded this graph from GISS homepage 18jan12

station.gif


I couldnt find a total length graph for Dublin but this one certainly looks a lot more like the old GISS rather than the new and improved GISS
Dublin%20Dec%202010.png


if crap like this can just be added at any time, how do we know what the real temps or trends are? a while back I showed a bunch of the changes Hansen put in during the 00's and how they changed the trend lines. this appears to be yet another wholesale change that affects not only today but all the climate papers that used GISS temps in the past. as far as I know you cant just download the numbers that were charted on a specific date or edition of the GISS dataset, so how are you supposed to figure out what numbers an article used?
 
old Port Elizabet, South Africa

image_thumb12.png


new Port Elizabet

station.gif


the problem is finding the old graphs, after that its simple. no wonder Africa and the Arctic are dark red on the GISS maps.
 
closer to home

2.%2BCasper%2BWY%2BGISS%2Btemp.png


station.gif


not as obvious as some of the others. the early part is dropped and the recent part is raised. remember! these corrections are just in the last year!
 
But your hero, Dr. Muller did a study with all the data available. And he sure showed that all the other scientists were lying, didn't he? No................

Well then, what did he say?

How come you are not still doing handstands over his study, Ian? A bit embarrassed? LOL
 
But you can still find the GISS graphs in Dr. Muller's data base. Along with his statement that the people at the various study groups were doing exemplary work.
 
Hmmm......... December, 2011 temperature, UAH 0.18 C.

Dec. 2010 UAH Global Temperature Update: +0.18 deg. C « Roy Spencer, Ph. D.

Have you noticed the relitively cold temperature for the last decade is actually above all but about 4 or 5 of the highest points prior to 1998? And above all the running average points prior to 1998. And we are in the midst of a double La Nina.

So, Ian, what the hell is going on? Did they park that satellite too close to a jetport, perhaps?
 
But your hero, Dr. Muller did a study with all the data available. And he sure showed that all the other scientists were lying, didn't he? No................

Well then, what did he say?

How come you are not still doing handstands over his study, Ian? A bit embarrassed? LOL

the BEST data set is still in peer review. like I said before, the method for chopping up the temperature series adds a warming bias by preferencially tossing out more cold readings than warm ones. that is why BEST is higher than the other data sets. it remains to be seen whether that methodology passes review. it appears that Hansen may be using a similar methodology in his latest set of adjustments, which of course are just imposed without discussion or review.
 
But you can still find the GISS graphs in Dr. Muller's data base. Along with his statement that the people at the various study groups were doing exemplary work.

the point of this thread is to show how much Hansen's GISS graphs have changed in the last year by showing historical GISS graphs and comparing them with the present day GISS graphs. if there has been that much change, how can we believe the recent interpretation? or for that matter, the past interpretations? one would think that the actual numbers read off a thermometer would be extremely stable because no one is going back in time to re-read them. but obviously there is a large amount difference over a short amount of time with the numbers contantly changing. how do you rationalize these wholesale changes? and why do they seem to always be in the direction of increasing the warming trend?
 
Hmmm......... December, 2011 temperature, UAH 0.18 C.

Dec. 2010 UAH Global Temperature Update: +0.18 deg. C « Roy Spencer, Ph. D.

Have you noticed the relitively cold temperature for the last decade is actually above all but about 4 or 5 of the highest points prior to 1998? And above all the running average points prior to 1998. And we are in the midst of a double La Nina.

So, Ian, what the hell is going on? Did they park that satellite too close to a jetport, perhaps?

there was a large step change in the 90's. something obviously happened in the 90's to increase the temps, and I can understand why anyone who had their thoughts crystalize into a formed opinion back then concerning global warming would be alarmed.

but since then there have only been normal fluctuations up and down with no increase or decrease of temperature. no rate of change differences that should be the hallmark of warming from CO2. perhaps you are right that some natural cooling mechanisms are masking the CO2 effect but climate science has done a pisspoor job of demonstrating that, let alone proving it.

as a sceptic I get all the other explanations, as a CAGW alarmist you only get one. its like someone betting on golf the last 15 years. if you only bet on Tiger then you were winning for quite a while but now things have changed and it is time to look deeper into the field for the best bet, even if it is not an obvious dynamic force like Tiger (or CO2) was during its heyday.
 
the new Jacksonville temps-

station.gif


the old Jacksonville temps-

2%2BFL%2BJacksonville%2BGISS%2Bstation.png


the old graph (taken from a blog article dated 26jun2011) has this interesting quote-
As a matter of interest I was in Jacksonville about a month ago, and talking with someone who used to have an orange orchard, but who had seen it die with the falling temperatures in winter, and the gradual movement south of the practical temperature for growing citrus crops. That is borne out by the fall in temperatures in Jacksonville.
Bit Tooth Energy: Florida combined temperatures

strange days indeed over at Hansen's GISS. is he making up numbers to save face? shameful, someone should get him to retire and then put an Ellliot Ness-type in charge to straighten things out.
 
here is the one that lead to Steve McIntyre to find the Y2K bug. originally the air conditioners were on a roof but then they were put on the ground next to the weather station. at first glance I didnt see much difference but then I looked at the rough average temp.

before-
Detroit_lakes_GISSplot.jpg


and now the recent one (today's)-
station.gif


why werent the 00's temps brought down to match the long historical record? why were all the previous records brought up to match the air conditioned records. and by air conditioned I mean the air conditioner exhaust influenced temperatures.

more info at Watts Up With That?: 1998 no longer the hottest year on record in USA
 
perhaps Old Rocks, Rolling Thunder or edthecynic can explain the need to endlessly reprocess all these historical data until they no longer have any meaningful connection to the past.
 

Forum List

Back
Top