Old Rocks
Diamond Member
Perhaps you can explain what is meant by science being a self correcting process. And why Dr. Muller didn't just give the data of the climate researchers a pass, but described their work as 'exemplary.
Follow along with the video below to see how to install our site as a web app on your home screen.

Note: This feature currently requires accessing the site using the built-in Safari browser.

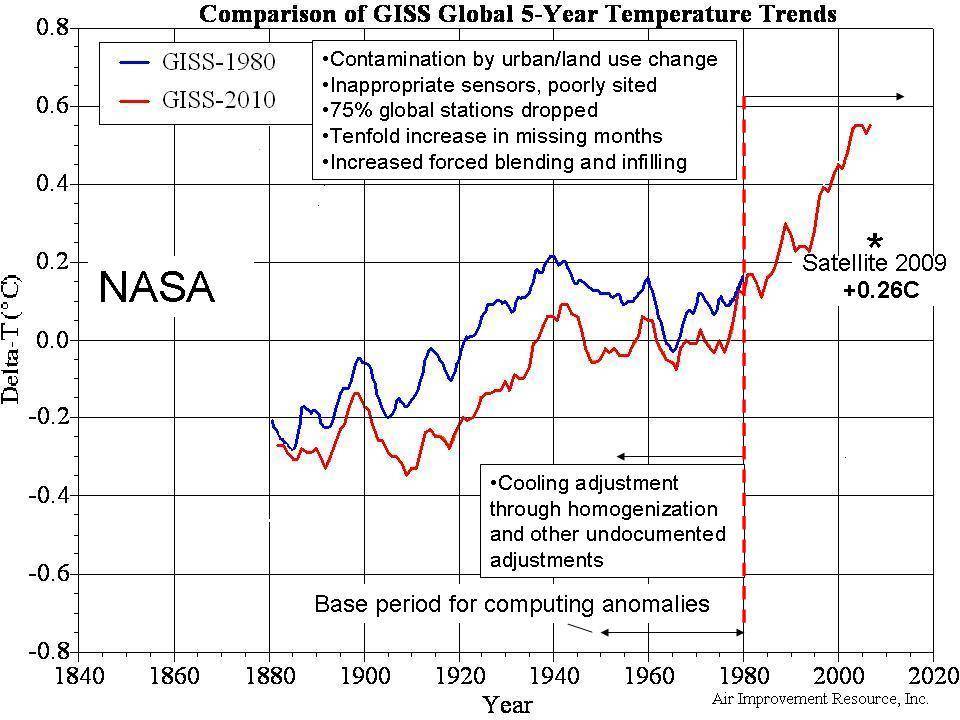
times have been rough over at the CAGW compound. mother nature just hasnt been co-operating like she did back in the good ol' days. the public has been hearing more and more conflicting results and disturbing reports of scientific impropriety in climate research.
what can CAGW luminary James Hansen do to bolster the rather limp data coming in? he has a brilliant idea! Muller's BEST project derived even higher temps than the other groups producing global temp data sets, and BEST was seen to be leaning towards the skeptical side. how did they do it? to make a long story short, the BEST algorithms chop up data histories and discard suspicious inputs. because there is a positive trend cooler data are much more likely to get discarded than warmer ones and the average goes up. just what Hansen needs!
Greenland data are sparse, noisy and often incomplete. perfect to try out this new idea. but I guess it was too much work so he just took out the (suspicious) data from the early 80's and then subtracted 1C from all the pre-1980 numbers. voila! the Nuuk temperature chart looks much better now.

here is a look at the 'adjustments'.

funny how so many years need exactly 1C fixing, isnt it?
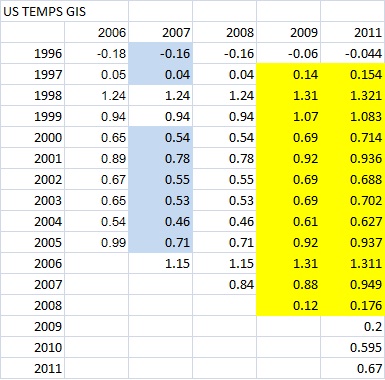
here is a graph from 2008 for those who think the comparator 'before' numbers might be wrong.

and the link to read the interesting article on how the AMO seems to affect arctic temps. Google Image Result for http://images.intellicast.com/App_Images/Article/128_1.gif

Perhaps you can explain what is meant by science being a self correcting process. And why Dr. Muller didn't just give the data of the climate researchers a pass, but described their work as 'exemplary.
another one

Ill leave the final words to Trausti Jonsson, one of the most experienced and respected scientists at the Iceland Met Office :-
In 1965 there was a real and very sudden climatic change in Iceland (deterioration). It was larger in the north than in the south and affected both the agriculture and fishing and therefore also the whole of society with soaring unemployment rates and a 50% devaluation of the local currency. It is very sad if this significant climatic change is being interpreted as an observation error and adjusted out of existence.
I have been working for more than 25 years in the field of historical climatology and have been guilty of eager overadjustments in the past as well as other data handling crimes. But as I have lived through these sudden large climatic shifts I know that they are very real.


this points out one of the main failings of making correction over correction over adjustment to all the temperature readings from the last 150 years. DO THEY MAKE SENSE IN THE REAL WORLD?????

this points out one of the main failings of making correction over correction over adjustment to all the temperature readings from the last 150 years. DO THEY MAKE SENSE IN THE REAL WORLD?????
another do-over by GISS
notice the y-axis! a 1C drop
and people think the temp data sets are accurate to a tenth or a hudredth of a degree! hahahahaha

Just a few minutes ago, I had displayed the GHCN temperature chart for Rochester, Minnesota, among others. With a dozen browser tabs open, I didn’t realise that the chart was still displayed, so I reselected it from the GISS station selector, and displayed it again. Unbelievably, the data had changed by a few tenths of a degree (both for early and late years) within ten minutes! Some kind of official investigation is needed of this unjustifiable shenanigans.

When I checked the datasets here and here, it was clear that the the small increase for 2011 was the result of November and December data being added in, which had been provisional before. However, much more intriguing was the fact that 1948 and 1949 had been wiped from the record. As the graphs show, these two years were comparatively warm, certainly much warmer than the following years.
Maybe errors had crept into the readings for these years to make them unreliable or a station move was responsible for a step change? Well, not according to the NCDC. The Climatological Summary for Rochester in 1950 shows the 1948 mean temperature was 44.9F (7.17C) and 1949’s was 46.0F (7.78C), in line with GISS’s original figures. The NCDC summary also shows that 1950 was much colder, again as GISS showed.
The summary also confirms that there had been no station moves or any other changes which would have affected the reliability of the record. So once again we see GISS/GHCN rewriting history to create an artificial warming trend.
GHCN Temperature Adjustments Affect 40% Of The Arctic « NOT A LOT OF PEOPLE KNOW THATEffect of The Adjustments
Appendix A lists every current GHCN station with records back to 1940,that lie between Greenland, at a latitude of 56 W, around to a point about midway across Siberia at 86 E and which are situated close to the Arctic Circle. The table shows the adjustment made by GHCN for 1940 data. Out of 26 stations, the adjustment has reduced actual temperatures in 23 cases, many substantially. In contrast, 2 remain unchanged and only one has a positive adjustment (and this is insignificant). As a crude average, the adjustment works out at a reduction of 0.70 C.
These adjustments typically extend back to the beginning of the station records (though Reykjavik is an exception) and most continue at the same level till about 1970. ( Some of the Russian stations last longer – e.g. Ostrov Dikson’s disappears in 2009).
By 2011, however, the adjustments disappear at ALL of these sites. In other words, an artificial warming trend has been manufactured.
It is worth spelling out two points :-
1) Within this arc of longitude, there are no other stations within the Arctic Circle.
2) With the exception of Lerwick and Vestmanneyja, I can find no stations, in the region, below a latitude of 64 North with similar adjustments. Why is 64 North significant? GISS produce zonal temperature data, and their “Arctic” zone goes from 64 North to the Pole. Coincidence?
Is there any justification for adjusting?
Trausti Jonsson, a senior climatologist at the Iceland Met Office, has already confirmed that he sees no reason for the adjustments in Iceland and that they themselves have already made any adjustments necessary due to station moves etc before sending the data onto GHCN.
Clearly the fact that nearly every station in the region has been adjusted disproves the idea that these sites are outliers, which give biased results not supported by nearby stations.
GHCN were asked in January to investigate this issue and so far have failed to come up with any explanation. Unless they can do this, the assumption must be that the adjustments have been created by faulty software.
another one
another one
bump for access